Want help to write your Essay or Assignments? Click here
The Impact of Brexit on the UK and the EU’s financial regulation
Introduction
The 1999 EU regulatory initiatives were meant to ensure that there were maximum financial markets activities among member countries. The regulations were also meant to contribute to the removal of existing legal barriers in the financial sector among EU members. The cross-border financial market initiative benefitted the UK and contributed to an increase in trade in the sector. However, Brexit’s move on 23rd June 2016 might have resulted in an end to the many of the financial conveniences that the UK enjoyed (Grant Thorton, 2016).
According to Wellink (2009: 13), and World Bank (2013: 15), regulatory arbitrage is one of the greatest disadvantages that can emerge from an exit of a country from a Union with existing guidelines and policies. According to Wen (2016), there is a possibility of businesses undercutting each other if the current financial market is deregulated. Brexit might contribute to deregulation of the UK’s financial sector, therefore contributing to undercutting of some firms through unscrupulous dealers. Some of the firms that have their headquarters in the region might initiate planning on moving to other regions that they consider favourable; especially those within the European Union coverage.
Institutions in the global financial market will be affected to great lengths as a result of Brexit. Institutions that are directly related to the UK or the European Union might have to “revise” the location of their headquarters or location of their subsidiaries. The adjustments are necessary for the firms to survive in the market. Brexit has a major impact on financial firms because the sector is strictly regulated, and might contribute to challenges especially for UK firms.
Impact and challenge of Brexit on the UK’s financial sector regulation
According to Claessens and Kodres (2014: 78), regulation of the financial sector contributes to securing of firms so that the shareholders’ wealth is maximized. The UK financial institutions will have to meet the requirements of strict regulations which emanate from Brussels. Before Brexit, the UK might have had an upper hand in negotiating for strict financial regulations such as their refusal on the imposition of tax bonuses. However, the EU might want to use them (UK) as an example of the disadvantages that countries are bound to face when they exist the EU.
The regulatory arbitrage for the UK might have complex consequences since some of the financial sector regulations for the UK and EU are different. The UK might have more strict rules in comparison to those that are issued by the EU. The EU might have less stringent rules based on the need to accommodate many different members who have different backgrounds.
The UK has been part of the EU for over forty years, and most of its financial sector laws are based on policies in the EU regulations. Therefore, Brexit could contribute to instability of the UK banking system since most of the financial regulations that have been in use, have not been enshrined in the UK law for the forty years that the country has been a member of the EU. The effects from pass porting will determine the future of the financial sector for the UK. It is not all gloom for the UK’s financial sector after Brexit since the country will attain independence to make its own decisions in the sector.
Any loopholes that might be used by firms for arbitrage purposes should be identified and sealed so as to minimize any chances of illegal activities. Banker bonus cap has been raised as one of the areas that the bank of England and the European Parliament discussed as possibly contributing to financial regulation arbitrage.
There will be immediate need of business continuous amidst the new and old regulations, or lack of clarity in the regulations that should be applied. Existing international financial firms that are located in the UK will have to make decisions on the viability of their current location. If the firms decide on a new location within the EU, they will have to make assessments on the suitability of a location that will contribute to a high level of business.
The short duration of confusion might lead to loss of business for some international firms. Financial firms in the UK will also have to ensure that they follow the MIFD II rules that will be established in 2018. The UK’s economy will be negatively impacted by a move of the financial firms that will want to relocate especially from London. Most of the international firms owned by EU member countries might want to relocate to other capital cities within the EU in order to make maximum gains.
The UK owned financial firms that have been conducting business in the EU will face higher costs and double rules if they will continue trading within the EU (Ashurst, 2016: 4). The low costs and EU financial regulation rules will no longer be accessible to those firms. Companies in the UK will also face stringent measures as required by the European Commission and the UK in the acquisition of partners from the EU.
The regulatory authorities in the UK are likely to increase the sector’s interest rates so as to make up on the deficit from being charged high rates through trade involving the EU. Clients will consider financial firms in the UK as being less stable as compared to those in the EU. Therefore, the clients might ask for higher returns on their investment based on the higher level of risk.
Financial firms will in turn have to invest in projects that have a high return, but take a long duration to give the expected profit on the investment made. The regulation of the financial sector institutions and supervision is largely national, even if the country is a member of a larger body (Omarova, 2010: 665: International Monetary Fund, 2009).
Evaluation of UK and EU’s financial regulation
The EU is quite strict on “bailing out” of companies since it results in the depression of the economy. Funds that could have been injected into projects contributing to the development of the economy, or boosting the economy are put into several companies that might not have a major positive impact on the economy (Heath, 2013: 32). Bailing out of companies by the government might contribute to lowering of ethical standards in companies.
The companies would know that the government would bail them out in the event that they collapsed. UK based financial companies are bound to face strict regulation especially since clients are likely to demand higher returns based on the higher level of risk. The EU is viewed as contributing to stability among its member states, and therefore making transactions that they engage in safer and more likely to give the planned return.
Want help to write your Essay or Assignments? Click here
The consequence arbitrage that has resulted from Brexit is highly influenced by non-financial effects of the initiative. The UK is no longer being considered as a major stakeholder in the making of foreign policies that might be required in times of conflict. Therefore, the UK has less bargaining power if it requires making deals with other countries. It is critical for a country to have a high bargaining power so as to negotiate trade and profitable financial agreements for its institutions (Weil, Fung, Graham, and Fagotta, 2006: 68).
The consequence arbitrage is the exit of major international financial institutions from London to other European Union capital centres. International financial organizations such as banks have already operated in the European Union and in the EU for decades. The move will contribute to the undoing of many years work, since the UK government has made numerous deals to bring the firms into the country (Ashurst, 2016: 4). Governments usually have to spend reasonable resources and adjust their regulations so as to be attractive to investors from foreign organizations.
Many other countries usually compete for the foreign firms. Therefore, countries have to ensure that their package offers are as friendly as possible. Furthermore, a financial Maginot line is necessary to deal with any eventualities that might arise such as collapsing of hedge funds. A hedge fund with a large volume of deposits could collapse and contribute to the collapse of banks in the region. The collapse or discovery of missing funds in a hedge fund could be triggered by sudden national financial moves such as the one triggered by Brexit.
Clearing houses might also contribute to negative consequences in the financial sector. According to Wen (2016: 9), clearing houses deals defaulting by a few traders can contribute to the system’s collapse. The collapse would result from the system’s insolvency. The central banks in different nations oversee the financial systems of those countries. However, there is no institution to oversee the central banks of different countries.
In the event of a collapse of the central banks of the countries involved in Brexit, there would be a collapse of all other financial institutions in involved nations. Financial regulatory organizations are focused on maintaining the regulations in place, especially because of the hefty fines that have been put in place. Therefore, in the event that the central bank was collapsing, it might take time for signs to be recognized by the financial firms that are the major focus of regulation.
Want help to write your Essay or Assignments? Click here
4.0 Conclusion
If it would not make the UK appear inconsistent, I would recommend a return to the European Union. However, since the decision and necessary steps have already been taken, the UK has to make do with its current situation. The UK has to establish clear guidelines in its financial sector since it has mostly used those in the European Union for about forty years. The opportunity should be utilized in coming up with financial sector regulations that will promote growth and have a competitive edge over countries in the European Union.
The regulatory authorities in the UK are likely to increase the sector’s interest rates so as to make up on the deficit from being charged high rates through trade involving the EU. However, the UK will have to come up with clear financial policies so as to mitigate the occurrence of a crisis. In the past, there has been severe and a high level of frequency of financial crisis that have occurred across the globe. The regulation and supervising of firms in the financial sector of a country is largely a national responsibility.
Both regulation and consequence arbitrage results are likely to be experienced by countries in the UK due to its exit from the European Union. There are international banks that have been situated in the UK for a long duration. These firms might have to relocate to other geographical locations in the EU so that they can continue enjoying the same regulations that they are used, especially if their parent firms are located in Europe (Ashurst, 2016: 6).
The geographical move would result in loss of revenue and employment for many UK nationals. Financial firms in the UK would be motivated to move because they would be expected to comply with a double regulation of the financial sector in EU, and that of the UK. Clearing houses could also contribute to a major collapse of the financial sector as a consequence of a failure of payment by a few dealers especially if they trade in high volumes. The solution to the possible loopholes that might occur is strict regulation of the financial sector for both the UK and EU.
Bibliography
Ashurst, 2016, Brexit: potential impact on the UK’s banking industry. Ashurst.
Claessens, S. and Kodres, L. 2014, The Regulatory Responses to the Global Financial Crisis: Some Uncomfortable Questions, IMF Working paper.
Heath, R., 2013, “Why Are the G-20 Data Gaps Initiative and the SDDS Plus Relevant for Financial Stability Analysis?” IMF Working Paper 13/6 (Washington: International Monetary Fund).
International Monetary Fund, 2009, “Restarting Securitization Markets: Policy Proposals and Pitfalls,” Chapter 2 in the Global Financial Stability Report (Washington: International Monetary Fund).
Omarova, Saule T., 2010, “Rethinking the Future of Self-Regulation in the Financial Industry,” Brooklyn Journal of International Law, 35, (3): 665.
Weil, D., Fung, A., Graham, M., and Fagotta, E. 2006, “The Effectiveness of Regulatory Disclosure Policies,” Journal of Policy Analysis and Management, Vol. 25, No. 1, pp. 155-81.
Want help to write your Essay or Assignments? Click here
Fermi Problems
Fermi problems are an estimated problem that is used to dimensional analysis and approximation and is often a back-of-the-envelope calculation. This type of estimation technique was named after the physicist Enrico Fermi, who was widely known for his approximation calculation prowess and at times, with little or no data. Fermi problems are used to justify guesses about their quantities and variance. Enrico has received worldwide recognition for most of his accomplishments, but the major one is his contribution to the development of the atomic bomb.
The talk by Lawrence is significant for physicians primarily to understand Fermi problems. Lawrence gives his viewers a physicist’s perspective of the world. He does so with the help of experiments, for example, he drops a book and a paper and asks which fall first while giving the explanation why the book fell first.
Want help to write your Essay or Assignments? Click here
The first of Fermi problems revolves around counting the number of equipment that is in a particular region for example piano tuners (Krauss, 2008). The first question is the number of people in the population, how many use keyboards and the number of families that own pianos. The second issue revolves around the number of substances that can fill another subject, for instance, the number of water balloons that can fill a room. One thing is to note the quantity of water that a single balloon can hold and the amount of water required to fill the room. Form there a simple calculation is exerted to find the number of approximated balloons and water.
There is a good chance that every time an individual breathes he/she takes in one molecule that was inhaled by Julius Caesar before his assassination. This was achieved using Avogadro’s number (6.02×10²³) and which multiplies the number of molecules in a single breathe and the atmosphere. The next step is finding out the volume of the atmosphere and through calculation arrives at the number of molecules that are consumed by each person.
The number of piano tuners in London varies from 50 to 125. This can be arrived by viewing the whole population in London and estimating the number of households that own one and calculating the number of houses that regularly tune a piano and how many times a piano can tune in a day.
Reference
Krauss, L. (2008). Commentary: World Lines by Lawrence Krauss. New Scientist, 198(2653), 50.
Want help to write your Essay or Assignments? Click here
According to economists, there are different ways of measuring the growth of an economy. According to Baldwin and Borrelli (2008), Gross Domestic Product is the commonly used measurement tool used to measure the economic growth of a given country. Nevertheless, certain economists believe that GDP is not a fully reliable method of measuring the growth of an economy.
In certain countries and institutions, improvement of the living standards can also be used as a tool for measuring the economic growth (David, 2005). GDP and other metrics such as unemployment rates, living standards, and inflation rates can help in determining the actual economic growth. Additionally, factors such as spending versus productivity can also help in quantifying the level of economic growth.
Comparative advantage and Absolute Advantage
According to David (2005), absolute advantage is the difference in the productivity of various countries while the comparative advantage denotes the differences that are there in the opportunity cost. Ideally, using smaller inputs to produce a large quantity of produce is known as an absolute advantage while the ability to produce at lower opportunity cost is a comparative advantage.
Therefore, certain countries such as China and the US have the absolute and comparative advantage at some point (Baldwin & Borrelli, 2008). For instance, the US use fewer resources to produce a given product compared to other countries. However, countries like China have a comparative advantage when they produce specific products at relatively lower margins.
Both absolute and comparative advantage are two main important factors for the international trade. These factors elaborate how different nations use the little resources that they have to produce given quantities of produce (Hansen, 2012). However, the advantage and the disadvantage of a country also depends on its choice of goods to produce.
For other countries, devoting resources and manpower to other countries limits competition. For example, the US would devote resources to the vehicle-producing Japan rather than compete with it. In which case, Japan would have the absolute advantage while the US has a comparative advantage.
China
Studies have revealed that China is one of the countries that continue to enjoy the advantage of its resources and human resources (Seretis & Tsaliki, 2016). China has overtaken countries like Japan to become the second-largest manufacturer after the US. Ideally, the country enjoys low labor costs while producing most of its products (David, 2005).
For China, the human resource is still an absolute advantage over many nations. The vast labor supply attracts larger investments and companies in the region. Compared to places such as the US where the human resource is declining, China enjoys a bigger absolute advantage (McConnell, 1999).
GDP Growth Rate in China
The Chinese economy has grown to 6.7% in 2016, which is by the expectations. The GDP growth in China has been successful hitting a high rate at 15.4% in 1993.
USA
Unlike China whose production is labour-intensive, the US enjoys a comparative advantage by using its specialized labor resource. In as much as the labor resource in the US is abundant, the country’s main advantage is that its human resource is skilled. As such, the US can produce high-quality products using its rich and skilled human resource.
GDP Growth in the US
The GDP in the US increased to 2.9% in the third quarter of 2016 1.4% higher than the last quarter. However, the increase is attributable to personal expenditure increases, the increase in exports, inventory investments as well as the increased federal government spending.
Saudi Arabia
Unlike other countries such as China and the US, Saudi Arabia is a country that relies on a single vast natural resource. According to Hansen (2012), this country would be poor without the large oil reserve. However, the nation enjoys a natural comparative advantage over other countries. With its large oil reserve, the country can engage in a profitable international trade with other major countries. As such, Saudi Arabia continues to enjoy a wealth of natural resource that gives it the extreme comparative advantage.
GDP growth Saudi Arabia
Saudi Arabia GDP grows at a rate of 0.5%. The Trading Economics analysts, the rate will remain 0.5% at the end of this quarter. However, the long-term growth rate is projected to increase to 3.5%.
Democratic Republic of Congo (DRC)
Likewise, DRC is another country that enjoys the vast amount of natural resources. This country has large scale diamonds and copper compared to other countries. With its large scale natural resources, this country enjoys an absolute advantage when it comes to trade. The GDP of DRC increased from $241.87 to $306.1 between 2009 and 2016. This, therefore, makes 2% of the global GDP.
Annual GDP Growth Rate
Unlike the increased GDP growth rates in most countries with absolute and comparative advantages, DRC remains one of the countries whose GDP is sluggish. The outraging political conflicts in DRC makes it hard for them to enjoy a stable economy. The growth rate in 2016 remains at 4.6%, which is low by 0.2% from the last rate.
Variance in Economies
The GDP growth varies across countries of various continents. However, Ural (2007) maintains that there are four main factors that determine the variations. The main factors that lead to variations in the GDP growth across countries include differences in the workforce, physical capital, human capital and technology differences (Shelburne, 2016).
Workforce Differences across Countries
The differences in workforce across countries affects the rate of GDP growth and the growth of the entire economy. Ideally, the differences depict the amount of labor that a given country has towards its production (Rnskov & Foss 2016). Countries like China have vast workforce I term of human resource. This helps them during production because they can get abundant labor as compared to other countries such as Saudi Arabia.
On the other side, the level of the workforce can also help a country in ensuring a large scale production. The abundant labor force is advantageous in production. As such, nations such as the US, China and India tend to have higher economic growth than the other countries.
Difference in Physical Capital across Countries
Physical capital is a determinant of economic growth. The larger the physical capital of a country, the stronger the economy of that country. For example, the US has a capital stock of $30 trillion compared to smaller countries such as DRC and Saudi Arabia. Although China’s physical capital is also high, analysts believe that the US enjoys more efficiency in production due to a larger physical capital that the nation has (Hansen, 2012). Physical capital helps a country to fund its production efficiently without outsourcing for credits. This makes various nations different from one another.
Human Capital Differences
Human capital refers to the value of the human resource that a country has. In most cases, developed countries have more valuable human resource than less developed countries. Grandke et al. (2015) reiterated that the value of human capital is measured by determining the level of education and level of skills that individuals of a given country possess. According to McConnell (1999), the level of education is correlated to the GDP growth.
Therefore, the differences in literacy levels in various countries lead to variations in the economic growth of different countries. For example, the US has high literacy levels than DRC and Saudi Arabia. Conversely, this affects the levels of expertise and skills that the human resource has in such countries. This difference explains why China and the US produce larger amounts of products that DRC and Saudi Arabia (Ural, 2007).
Technology Differences
Technology is fundamental in the production and growth of an economy. Rnskov and Foss (2016) opine that despite capital, human resource and workforce levels, the availability of technology also helps in determining the rate of production and consequently the economy. Through Research and Development, large firms can acquire knowledge and skills of producing various products (Shelburne, 2016).
To produce efficiently, individual countries must use the right technology. Nonetheless, the cost of employing the right technology in production can only be met by specific countries that have stronger and stable economies. For example, countries such as China and the US have the capacity to acquire the right technology for production. On the other hand, countries such as DRC lack the adequate capital to acquire the right technologies in production (Seretis & Tsaliki, 2016).
In most cases, countries such as Saudi Arabia and DRC will import technology from other countries such as China and the US. Technology increases efficiency. Thus, it determines the levels of output. The nature of the technology used by a particular company helps in achieving a high level of production (Rnskov & Foss, 2016).
Trade and the Strength of Economy
Trade is one of the drivers of economic growth. International trade is attributable to economic development by reducing the levels of poverty while increasing the commercial opportunities for countries. Through trade, countries like China and Saudi Arabia have expanded their production rates. Additionally, trade increases the value of investments in various countries as they go up into the global value chain.
The international trade facilitates diversification of exports thus, helping countries to access fresh markets internationally. On the other side, trade ignites innovation through the exchange of technologies and expertise (Grandke et al. 2015). It is through trade that countries such as China and the US have the ability to create employment opportunities to their populations. Moreover, trade helps in stabilizing the relationships between various nations thus, creating peace and harmonious environments that facilitate development (Shelburne, 2016).
Lifecycle of Trade
Trade life cycle comprises of the stages that the trade goes through. With the predicted outcomes and objectives at hand, trade life cycle is supposed to represent the forecasted events. Grandke et al. (2015), acknowledge that stages of a trade determine the progression of the trade from its inception throughout its progression. Different countries go through different stages of trade life cycle.
To execute a trade, various processes and procedures must be followed. Ideally, the stages determine the success or failure of the trade. In most cases, the processes start with the execution of trade after the agreements have been made. In cases of international trade, Rnskov and Foss (2016) note that the stages of trade are determined by the progress made in previous stages (Shelburne, 2016). For instance, countries such as China and the US have established trade lifecycles compared to developing countries such as DRC. Based on a country’s resources, trade lifecycle can be efficient.
References
Baldwin, N., & Borrelli, S. A. (2008). Education and economic growth in the United States: Cross-national applications for an intra-national path analysis.Policy Sciences, 41(3), 183-204. doi:http://dx.doi.org/10.1007/s11077-008-9062-2
David, H. L. (2005). So many measures of trade openness and policy: Do any explain economic growth? (Order No. 3179497). Available from ABI/INFORM Collection. (305006923). Retrieved from http://search.proquest.com/docview/305006923?accountid=45049
Grandke, F., Singh, P., Heuven, H. M., De Haan, J. R., & Metzler, D. (2016). Advantages of Continuous Genotype Values over Genotype Classes for Gwas in Higher Polyploids: A Comparative Study in Hexaploid Chrysanthemum. Bmc Genomics, 171-9.
Hansen, T. J. (2012). The use of business tax incentives: An analysis of the economic performance of minnesota’s JOBZ (job opportunity building zones) program (Order No. 3503148). Available from ABI/INFORM Collection. (1009056994). Retrieved from http://search.proquest.com/docview/1009056994?accountid=45049
Mazurek, J. (2015). A Comparison of GDP Growth of European Countries during 2008-2012 from the Regional and Other Perspectives. Comparative Economic Research, 18(3), 5-18.
McConnell, I. E. (1999). Trade and the environment: Defining a role for the world trade organization (Order No. NQ41085). Available from ABI/INFORM Collection. (304561048). Retrieved from http://search.proquest.com/docview/304561048?accountid=45049
Ørnskov, C., & Foss, N. J. (2016). Institutions, Entrepreneurship, And Economic Growth: What Do We Know And What Do We Still Need To Know? Academy Of Management Perspectives, 30(3), 292-315.
Rnskov, C., & Foss, N. J. (2016). Institutions, Entrepreneurship, And Economic Growth: What Do We Know And What Do We Still Need To Know? Academy Of Management Perspectives, 30(3), 292-315. Doi:10.5465/Amp.2015.0135
Seretis, S. A., & Tsaliki, P. V. (2016). Absolute Advantage and International Trade. Review of Radical Political Economics, 48(3), 438-451
Shelburne, C. R. (2016). Long-Run Economic Growth: Stagnations, Explosions and the Middle Income Trap. Global Economy Journal, 16(3), 433-458.
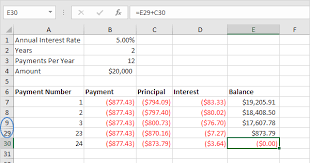
An amortization schedule refers to a tabular presentation of the mortgage loan payment schedule, indicating the interest and principal amount paid until the loan is repaid fully (Brechner & Bergeman, 2014). An amortization calculator is used in developing the schedule, based on the amount, interest rate and repayment period. The amortization schedule is generally utilized for identifying the amount paid, to both interest and principal, and the outstanding balance.
An amortization schedule helps in the generation of identical payment over the repayment period, such that the entire amount is paid by the end of the period (Biafore, 2013).
The schedule is used in determining the percentage of interest to be paid during each period in comparison to the principal amount to be repaid. In essence, it separates the portion of payment that covers the interest expense from the portion the premium paid to the principal in each period. Biafore (2013) notes that even though a similar amount of premium is paid towards the mortgage each period, the amount allocated to the principal and interest varies each time.
This variation can be observed from the amortization table. The amortization schedule ensures that the borrower and lender are on the same page with regards to the amount repaid and amount owed. This means that in case of any dispute, the schedule acts as reference on the history of payment and pending balances.
The amortization table is useful to the borrowers in that it is a basis for organizing their finances. The borrower is able to track payments made, interest paid and money owed at any given time; such that they can determine their home equity at any given time. Lenders on the other hand can track what is owed by borrowers.
Response 3
In amortizing the mortgage, a significant amount of the payments paid during the initial months mostly comprises of interest, while the remaining amount is paid to the principal (Biafore, 2013). The payments to interest then start declining as the mortgage is repaid, such that the interest paid in the later years is minimal or none.
Accordingly, the tax deducted based on home mortgage interest is likely to be higher during the initial years when a larger amount of interest is being paid, compared to later years when the interest being paid has reduced significantly. In this regard, it is logical to state that interest paid in earlier years plays a more helpful role in in tax reduction than interest paid in forthcoming years.
Response 4
An ordinary annuity differs from annuity due, mainly based on the timing. While the amount due in ordinary annuity is paid at each period end, an annuity due consists of cash flow series that occurs at each period’s beginning. The second difference is related with payment. In ordinary annuity, the payment done is associated with the period that precedes its date (Ehrhardt & Brigham, 2016).
Examples include mortgage payment, loans and coupon bearing bonds. Payment in an annuity due on the other hand, is associated with the period that follows its date. Examples include insurance premiums and rental lease payments.
Problems
If interest rates are 8 percent, what is the future value of a $400 annuity payment over six years? Unless otherwise directed, assume annual compounding periods.
Future Value (FV) = P x [((1 + r) n – 1) / r]
Where P = Annual payments
r = Interest rate
n = Number of years
FV = 400 x [((1 + 0.08)6 -1)/ 0.08]
= $2,934.37
Recalculate the future value at 6 percent interest and 9 percent interest.
6% Interest
FV = 400 x [((1 + 0.06)6 -1)/ 0.06]
= $2,790.13
9% interest
FV = 400 x [((1 + 0.09)6 -1)/ 0.09]
= $3,009.33
If interest rates are 5 percent, what is the present value of a $900 annuity payment over three years? Unless otherwise directed, assume annual compounding periods.
Present Value (PV) = P [(1 – (1 / (1 + r)n)) / r]
Where P = Annual payments
r = Interest rate
n = Number of years
PV = $900 [(1 – (1/(1+0.05)3))/0.05]
= $2,450.92
Recalculate the present value at 10 percent interest and 13 percent interest.
10 Percent
PV = $900 [(1 – (1/(1+0.1)3))/0.1]
= $2,238.17
13 Percent
PV = $900 [(1 – (1/(1+0.13)3))/0.13]
= $2,125.04
What is the present value of a series of $1150 payments made every year for 14 years when the discount rate is 9 percent?
Present Value (PV) = P [(1 – (1 / (1 + r)n)) / r]
Where P = Annual payments
r = Interest rate
n = Number of years
PV = $1150 [(1 – (1/(1+0.09)14))/0.09]
= $ 8,954.07
Recalculate the present value using discount rate of 11 percent and 12 percent.
11 Percent
PV = $1150 [(1 – (1/(1+0.11)14))/ 0.11]
= $8029.15
12 Percent
PV = $1150 [(1 – (1/(1+0.12)14))/ 0.12]
= $7,622.39
References
Biafore, B. (2013). QuickBooks 2014: The Missing Manual: The Official Intuit Guide toQuickBooks 2014. Sebastopol, CA: O’Reilly Media, Inc.
Health care is a necessity for everyone and the expenses are inevitable. Everyone deserves the health care they need from the right provider at the right time (Quincy, 2016). Another difference is the cost of drugs compared to other nations and a lot of people consider it to be unreasonable. In majority of the countries, there is negotiation done by the government to control drug prices with the manufacturers, but the existence of Medicare Part D denies Medicare to negotiate prices. This is why a branded drug costs higher when bought in the U.S.A. compared to other countries. However, this is beneficial to the doctors because of the higher earning they get if they do this compared to other countries. Additionally, a lot of drug suppliers charge more in the U.S. for medical equipment.
The top drivers of health care are chosen lifestyle, utilization, price inflation and mandated benefits. The society today is a culture that favors diagnosis and treatment rather than living healthily and preventing disease. It is still a necessity for consumers to have a healthy mindset and practice a better lifestyle for disease prevention. Due to the increase in utilization, there has been a rise in health care costs and the forms are not all the same (Smart Business, 2009). There is a total of 70% health care costs that come from employee behavior linked to cancers, diabetes, cardiovascular disease, and obesity. Moreover, advertising deceives consumers and make them think prescriptions and procedures could cure their conditions. This is why consumers end up getting unnecessary treatment and the rise of new technology is also a factor why health care costs increase.
Supply and demand seems to be an automatic reason why health care costs more in the USA. There are two answers for this because there can be an increase in prices due to demand and the other reason is because of limited supply, prices are higher (Theory and Applications of Microeconomics, 2012). However, price is not the only thing that matters in supply and demand in health care because it is a fundamental commodity that is relevant to a person’s well-being. A lot of people want health improvement and this is why they demand for health care. Although, the health’s relationship to health care is not direct because even if health care impacts health, a lot of other things can be a factor. Health is considered as a good, but other goods are more tangible compared to it due to its characteristics. People cannot pass on or trade their health with others, except for certain diseases.
Quality health care had always been a main focus and the medical professionals attempted to improve their practice and give the best care in the world, but the results are not equal. The number of medical practitioners in an area is linked with the type of health care they can provide. Therefore, if there is a shortage in workforce, the quality of health care in the area with fewer medical practitioners are going to suffer. There is a health care reimbursement model to pay-for-performance that provides incentives or penalties from patient outcomes and frequency of readmission (Anderson DNP, RN, CNE 2014). If the workforce is weak, pay-for-performance will suffer in some areas. This will lead to a higher demand for services, but limits the access of patients to health care.
Technology and computers could increase health costs of today since majority of medical equipment needs digital platforms to function properly that makes medical facilities dependent on software. This increases health care costs so it becomes inaccessible to those who cannot afford it. Furthermore, there are a lot of elements that cause an increase in health care costs. And to an average patient, technology gives them helplessness and vulnerability.
One example is echocardiography which has the immense capability to detect ailments and it is safe for everyone. In order to interpret the images, an expert is called to do this. Unfortunately, not all companies have this machine and there is no way to make it inexpensive so any patient can have access to its services (Kumar, 2011). Therefore, technology and computers improve the quality of healthcare, but it contributes to the increase in costs.
Since resources are scarce, organizations have disease management. Those suffering from chronic illnesses need more healthcare attention like hospitalization, physician visits, and prescription drugs. The objective of disease management is to improve the condition of those with chronic illnesses and lessen the use and cost of health care services that are linked to preventing complications (Georgetown University, 2017).
Before the organization implements disease management, they first have to know the population and how patients will enroll. They use demographics to find out which patients are going to need disease management program the most. The chronic diseases such as diabetes, asthma, and hypertension are included.
Furthermore, this increases public awareness which has a significant impact in the way decisions are made on the medical care received by the patient.
1) Rights and advantages belonging to shareholders
Shareholders of a company enjoy following rights and advantages
Ownership right: Shareholders being owners of the company enjoy the right to share residual profits left after paying preference dividend. Their rate of dividend is not fixed. It depends upon the amount of profits. Sometimes they get high dividend in case of high profits.
Control over management: Shareholders can exercise their control over management through the election of their representatives in the board of directors.
The voting right: Shareholders have the right to attend annual general meetings of the company and cast their vote in person or through proxy on various resolutions passed in such meetings. This enables them to participate in corporate and managerial affairs without having to regularly manage affairs directly.
Pre-emptive right: At the time of further issue of shares, an offer is made to shareholders first. If shares are left, they are offered to outsiders. It enables them to maintain their proportionate shareholding intact in the company ( H.Sherman, 2011).
Transfer of the ownership: Shareholders enjoy the right to transfer the ownership of their securities to others by trading their stock on the stock exchange.
2) (a)Differences between the S&P 500 Index and the Dow Jones Industrial Average
Both Dow Jones Industrial Average (DJIA) and the S&P 500 are the best known index of American stocks but differentiate from each other in the following manner.
Criterion
Dow Jones Industrial Average
S&P 500
Introduction
It is an oldest stock market index which was introduced in 1896 by Charles Dow (Johnson, 2015).
S&P 500 was introduced by S&P Global in 1923 and in its current form, it was published in 1957 ( S&P Dow Jones Indices LLC, 2016).
Index Constituents
DJIA is composed of thirty publicly traded American companies listed in NYSE and NASDAQ. These stocks are picked by an editor of The Wall Street Journal. It covers a large range of industries in the US except transport and utilities ( S&P Dow Jones Indices LLC, 2016).
It is based on market capitalization of 500 large companies listed in NYSE and NASDAQ. It covers a wide range of industries.
Weighting Method
It is a price-weighted index which is calculated by taking the aggregate of prices of stocks in an index and divided by a common divisor (Johnson, 2015). The stocks having high prices have more weightage in this index.
It is a free float capitalization weighted index where in components are weighted on the basis of their market capitalization ( S&P Dow Jones Indices LLC, 2016). The stocks with higher market capitalization have more weightage in this index.
(b)Better measure of stock market performance
The S&P 500 is considered to be the better measure of stock market performance than DJIA because it covers approximately 80% of the stock market capitalization and is considered as a true representative of happenings in the US stock market ( S&P Dow Jones Indices LLC, 2016). DJIA covers 30 securities only and its popularity is because of being an oldest index.
3) Differences between common stock and preferred stock
The main two types of stock issued by companies are common stock and preferred stock which have some similarities as well as dissimilarities. The main dissimilarities between both are given as below:
Criterion
Preferred Stock
Common Stock
Meaning
Preferred stock is a hybrid security which combines features of common stocks as well as debt securities (H.Sherman, 2011). The preference dividend is paid at a fixed rate just like payment of interest at fixed rate, but it is paid out of post-tax profits. It is not termed as ownership security.
Common stock is termed as ownership security. Its rate of dividend is not fixed. It depends upon the amount of profits. The amount of dividend may be high in case of high profits and it may be low or even nil in case of low or no profits.
Preferences
Preferred stock carries two preferences over common stock which are (i) Preferred stockholders are paid dividend first before the dividend is declared for common stockholders. (ii) At the time of liquidation of company, preferred stock is redeemed first before any amount is paid to common stockholders (Weaver & Weston, 2001).
Common stock holders are paid their periodic dividend as well as redemption value after satisfying claims of preferred stockholders
Rights
Preferred stocks do not carry any voting right. But holders get entitled to vote when (i) The dividend has remained unpaid for a specified number of years (H.Sherman, 2011). (ii) The resolution to be passed at the meeting has any impact on their interest.
Common stock provides many rights to stock holders which includes voting rights on corporate and managerial issues and preemptive right. Pre-emptive right is the right given to stockholders to maintain their proportionate ownership in the company at the time of further issue of share (Broadridge Advisor Solutions, 2017).
H.Sherman, E. (2011). The Equity in the Business. In E. H.Sherman, Finance and accounting for nonfinancial managers (pp. 204-205). New York: NY: American Management Association.
Weaver, S., & Weston, J. F. (2001). Financial Statements and Cash flows. In S. Weaver, & J. F. Weston, Finance and Accounting for Non-financial Managers (pp. 26-28). New York: NY: Mc Graw Hill.
Want help to write your Essay or Assignments? Click here
Ques1. Explain what a call provision enables bond issuers to do? Why would bond issuers exercise a call provision?
Answer: A call provision is a clause, mentioned in the bond certificate, which enables the bond issuer to repay or redeem bonds before its maturity date at a specified value (Sherman, 2011). Conditions related to time of redemption or buy back of bonds like amount to be repaid and manner in which payment is to be made are mentioned in advance. This call provision is exercised by the bond issuer at the time when the interest rates have fallen and debts are available at cheaper rate in the market. The issuer redeems the bond carrying high rate of interest and issues new bonds with low rate of interest.
Ques.2 Define a discount bond and premium bond. Provide example of each.
The bond issued by the company for the first time is a standard bond. It becomes discount bond or premium bond depending upon the price at which it is being traded in the market.
Discount bond: If the bond is being traded in the market at a price which is less than the face value, it will be termed as discount bond (Weaver & Weston, 2001). A bond becomes discount bond when it gives interest at a rate which is less than the market rate of interest. The investor will be ready to invest in bonds with lower interest rate if the purchase price of such bond is fixed in such a manner that it compensates the investor for less payment of interest in future. For example: A 5% bond is being issued at $1000. The market interest rate is 4%. The investor will be ready to invest in such bonds if the issue price is less than $1000.
Premium bond: If the bond is being traded in the market at a price which is higher than the face value, it will be termed as premium bond. A bond becomes premium bond, it its coupon rate of interest is more than the prevailing interest rate in the market. The issuer will be ready to issue such bonds if the price is fixed in such a manner that it compensates the issuer for higher payment of interest in future. For example: A 5% bond is being issued at $1000. The market interest rate is 6%. The issuer will be ready to issue such bonds if the price is more than $1000.
Ques3. What is the relationship between interest rates and bond prices?
Answer: The fundamental principle of investment in bond market is that there is inverse relationship between interest rates prevailing in the market and bond prices (SEC, 2013).
In market interest rate in bond price
In market interest rate in bond price
If the market interest rate goes up, the investor will be ready to buy bonds with low coupon rate if they are being offered at discount or low price. The investor want compensation for low interest payments to be received in future so he will be ready to buy such debentures if they are being offered at low prices. Similarly if the market interest rate goes down, the investor will be ready to buy the bonds with high coupon rate even at high prices. Thus prices of bond increase.
Ques 4: Describe the difference between coupon bond and zero coupon bond
Answer: The coupon bond is a bond which has coupon rate at which the interest is paid to the bondholder throughout the life of bonds (Sherman, 2011). The bonds are issued with interest coupons and interest is paid to the person who has the possession of coupon. The payment of interest is made at coupon rate and it may be paid quarterly, semi-annually or annually.
Zero coupon bond is a bond which does not carry any coupon of interest as no interest is payable on such bonds. These bonds are issued at deep discount and redeemed at face value on the maturity period. The difference between the issue price and the redemption value is the appreciation value and return for the investor (Weaver & Weston, 2001).
The return for the coupon bondholders is regular in nature whereas the return in case of zero coupon bonds is in the nature of capital appreciation.
Agriculture has been an imperative supporter of the GDP of Bhutan since the absolute starting point. Its commitment to the GDP has been recorded at 38% in the year 1995 with 85% of the populace subordinate upon it; the commitment was 35.9% in the year 2010. In spite of the fact that the commitment of agribusiness declined from 55 % (1985) to 33% (2013) of GDP, despite everything it stays as a prevailing element in the economy of the nation. However, in the most recent decade, the commitment of agribusiness has tumbled to 16.7% of GDP. The issue of accomplishing independence lies intensely on the shoulder of this part as, without improvement of the essential segment, the advancement of the auxiliary area and thusly, advancement of the country can’t be accomplished to the full. The decline of roughly half in 10 years flags that this area requires quick consideration. This examination goes for distinguishing how, the foundation of particular Financial Institutions for Agriculture like; ‘National Bank for Agriculture and Rural Development’ (NABARD, India), can help in building up this segment. This examination endeavors to take shape the part that such particular organizations need to play, since they can give tweaked answers for various necessities in the agrarian segment of a nation, as structures, plans, plans, approaches and methodology, and open the ranchers to the present day innovations and techniques for horticulture.
Introduction
A standout amongst the most imperative parts of the lives of individuals and the financial state of a country is agribusiness. For millenniums, rural exercises have overwhelmed the lives of individuals around the world. In the cutting edge world, horticulture has turned out to be more logical and Innovation situated pointed towards accomplishing higher generation, and in this way, financing farming assumes a crucial part today. This is the place Agricultural Micro finance ends up plainly significant. It assumes an exceedingly critical part in empowering horticultural exercises in many countries. In 2019, there were more than 74 million micro finance borrowers around the world, and the aggregate credit portfolio was about $38 billion USD. On the off chance that we consider Bhutan, horticulture remains the second biggest supporter of GDP quickly after hydro power era. In the meantime, the present rupee emergency in Bhutan has demonstrated that one of the zones in which Bhutan needs to gain a quick and relentless ground is accomplishing self-manageability in nourishment generation. In 2011, Bhutan imported about Nu.286 million worth of vegetables and Nu.1.1 billion worth of rice2, and there couldn’t be a superior time for the country to truly respect the conceivable methods for enhancing its farming generation and diminish its reliance on imports, which channels profitable and hard earned remote cash adding up to Rs.4 billion in the year 2011. The nation has a potential for building up its agribusiness further. One method for achieving this is to guarantee the accessibility of simple credit to the agriculturists in the nation.
This paper endeavors to comprehend the present circumstance of farming micro credit in Bhutan and tries to comprehend the conceivable advantages of extending the extent of rural micro credit and auxiliary administrations through particular foundations in the nation.
Literature Behind Research on Agriculture in Bhutan
On the off chance that we consider micro finance, or all the more particularly microcredit, which concentrates on stretching out little credits to ranchers and was made well known by Grameen Bank in Bangladesh, is a moderately new idea. The advancement and extension of micro finance on the planet can be clarified by the accompanying outline:
2010 – 2012
2012-2014
2014-2015
2015-2017
Expansion
Increase
Commercialization
Transformation
As portrayed by Srnec K., et al. (2018), micro finance establishments around the globe experienced approximately four phases of advancement to be specific, the mid 80’s the place numerous MFIs (micro finance organizations) had a superior rate of return than banks. In the mid 90’s, the place a couple of MFIs started taking care of every one of their costs, a couple of best MFIs started to pull in noteworthy business subsidizing, and were never again restricted to a little gathering of scattered organizations, making it a quickly developing industry and today where MFIs have changed from being casual micro finance foundations to more formal establishments.
The very structure of micro finance foundations has experienced a critical change as of late. Micro finance organizations, as well as standard banks the world over have started to understand the estimation of micro finance and are starting to take into account this division. As indicated by a report distributed by Infosys4, just 28 percent of the aggregate requests for micro finance administrations were secured by the MFIs all inclusive by 2010. The World Bank assessed a micro finance necessity of USD 300 billion out of 2010.
However, in spite of being the centerpiece of provincial and agrarian advancement programs in numerous nations for quite a while, micro finance has likewise pulled in impressive feedback, and many individuals question the adequacy of micro finance establishments. As clarified by Hendrayadi, Irfan, et al, in their paper ‘What is ‘Afflict ing’ the Agricultural Micro Finance Model?’, the objective of the country fund was to advance agrarian improvement through focused medications intended to increment provincial loaning while at the same time decreasing the expenses and dangers to moneylenders. The ultimate result of this approach neglected to achieve its Objective. Initially, sponsored loan costs did not permit provincial back organizations (RFIs) to take care of their expenses. Besides, financed credit extremely regularly focused on the wrong items, which prompted expansion underway wasteful aspects. Therefore, the quantity of nonperforming advances expanded drastically. In the 1970s, horticultural loaning represented more than 30 percent of all World Bank loaning; in any case, by 2010, this number dipped to 10 percent. The measure of Official Development Assistance (ODA) given by OECD nations to rural ventures dropped impressively also. Subsequently, the genuine net guide to farming in the 1990s dropped to a 35 percent of its level in the 1980s.
Another trouble confronted by micro finance establishments around the world was that, in spite of being organizations of simple credit, the loan fees charged by these foundations was still very high. As clarified by Bateman (2011), in the beginning of micro finance organizations, higher rates were important to take care of the high operational expenses of giving small advances to poor people, yet that financing costs would fall in view of rivalry. This contention had some legitimacy at first. In any case, loan costs have not fallen as much as anticipated, and in a few nations (quite Mexico), they have stayed high. To some degree, this was a direct result of the accentuation on.
The business show, with MFIs, now required producing high monetary prizes for their directors (pay rates, rewards) and proprietors/investors (profits and capital increases). Different impediments that hampered the development of micro finance was an absence of legitimate insurance from agriculturists as they were frequently excessively poor, making it impossible to keep resources as guarantee, however as clarified by Llanto (2017), endeavor credits, including advances to poor people (for the most part ladies), did not really require the customary land guarantee as security. MFIs have loaned to resource fewer people and have effectively recuperated the credits. However, nothing from what was just mentioned issues are without arrangement. Bateman (2011) and Llanto (2017) have worried on the requirement for hearty money related control to guarantee that neighborhood budgetary establishments act in a way helpful for maintainable nearby financial improvement and to building and holding neighborhood social capital, yet with a notice that exorbitant direction may suffocate creative micro finance rehearses. Llanto (2017), Hendrayadi, Irfan, et al. what’s more, Miller (2011), have likewise worried on broadening credit portfolios by micro finance foundations, which can be expert by consolidating horticultural advances with different sorts of advances, for example, urban advances, lodging advances, investment funds, protection, etc. Bateman (2011) has even recommended that nearby smaller scale reserve funds ought to be considered as an initial phase in the collection of capital. One of the components unfavourable to establishments occupied with rural loaning as recommended by Llanto (2017) is inordinate government intercession and government endowments, which may not be manageable over the long haul. This is one region where Bhutan ought to be particularly watchful about. We will next consider the micro finance situation in Bhutan and attempt to comprehend its present patterns and future prospects.
Research METHODOLOGY and Design
Planning reasonable strategy and choice of logical instruments is imperative for an important investigation of any exploration issues. This segment is dedicated to the announcement of the technique, which incorporates accumulation of information, examining the system, strategy for investigation and apparatuses of examination.
Gathering of Data
Both essential and optional information has been utilized for the present investigation. An observational study was made among the chosen recipients to get to know the advance sum got, used and reimbursed. On the premise of the data assembled, a very much outlined pre-tried meeting plan was drafted and utilized as a part of the field review to gather the essential information (Vide Appendix-I). Before undertaking the principal review, a provisional meeting plan was arranged and regulated to 25 recipients so as to test the legitimacy of the meeting plan. It encouraged tresearchhe expulsion of the none–response and undesirable inquiries and the altered last timetable in view of this were readied.
The chose recipients were reached face to face and the goals of the examination were obviously disclosed to them and their co-operation was guaranteed. The insights with respect to the general attributes of the example recipients, their families, salary, use, and investment funds identifying with the general targets of the investigation were gathered from the specimen recipients through the immediate individual meeting technique.
Auxiliary wellsprings of information identifying with the readiness to benefit from advances, the number of advances endorsed, advance sums were gathered from the distributed and unpublished reports and records of the BDFCL.
Inspecting Procedure
Bhutan Development Finance Corporation Limited has 22 branches in every one of the twenty locales in Bhutan. With the end goal of gathering essential information from the recipients and recuperation execution, all the 22 branches were incorporated for the present investigation. Out of 22 branches, a sum of 300 borrowers under different plans was chosen indiscriminately for the investigation.
Time Line
Keeping in perspective of the goals of the investigation, 300 example recipients were stratified into two classes specifically, the individuals who have occupied with non-modern exercises and others taking part in mechanical exercises. Out of 300 specimen recipients, 182 (66.67 for each penny) recipients were going to non-mechanical gathering and the staying 118 (39.33 for every penny) fell under the modern gathering.
Objectives of Study:
i. To comprehend the difficulties and openings that specific money related foundations taking into account the farming part have.
ii. To assess the condition of agrarian micro finance in Bhutan.
iii. To propose strategies that may be valuable in assist improvement of such specific monetary establishments.
Research Design: Descriptive research
Information Sources: Optional information gathered from different electronic sources, for example, sites, articles and daily paper diaries accessible on the web, and so forth.
Land reaches out of the examination:
Impediments: The investing+ation is restricted by the way that there has is just a single budgetary organization taking into account rural micro finance in Bhutan. Hence, the measure of data accessible here is very restricted, and not very many examinations have been led identified with this decision, and this has constrained the extent of our investigation.
Research Questions:
Why couldn’t farmers grab the funds in order to approach the require GDP prescribed by the Governmental Agencies of Agricultural Development fields and lands?
What are the major correlations and stats of Agricultural Development Land Authority of Bhutan regarding the production of crops from the year 2014 to 2017?
What are the aspects of agricultural development regarding farmers low budget criteria and how can governmental agencies handle this crisis?
What are the GDP targets regarding farmers infrastructure development at agricultural lands?
The state of Specialized Micro Finance Institutions in Bhutan
As we consider micro finance establishments in Bhutan, we understand that it is still in an incipient stage. Country credit in Bhutan was begun in 1980. It was ordered for Bank of Bhutan (BOB) to loan 44% of its portfolio in country credit, be that as it may, it loaned under 1% of its portfolio. The reasons were ranchers’ failure to meet the security and assurance prerequisite of the BOB and RICB (Royal Insurance Corporation of Bhutan). At that point, the provincial loaning program was depended to Food Corporation of Bhutan in 1980. Nourishment Corporation of Bhutan acquired cash at 14% enthusiasm from BOB and RICB and re-loaned the sum at 6% to 10% to agriculturists. This program kept going just two years. The program was then moved to Royal Monetary Authority (the national bank of Bhutan). As BOB and RICB were discovered one-sided towards general exchange, transport, and land, it was felt important to build up a different budgetary establishment to give advances to mechanical and farming related exercises. In this unique circumstance, with the marking of Royal Charter (RC) on January 31, 1988, Bhutan Development Finance Corporation Ltd. (BDFC) (which is right now known as Bhutan Development Bank Limited (BDBL)) was built up. At that point, the rustic credit program was given over to BDFC. From that point, forward BDFC (now, BDBL) has been executing Agricultural Credit in Bhutan.
Other casual methods for loaning to ranchers likewise exist in Bhutan as portrayed by Hussein (2019, for example, moneylenders, who exist inadequately in a few districts and charge an enthusiasm of 3%-5% and well to do families and people who additionally advance out to poor villagers now and again. Different banks incorporate devout foundations that loan at a higher rate of 15%-25%, and semi-formal loaning organizations, for example, the National Women Association of Bhutan (NWAB), which goes for giving gifted preparing and gathering loaning to ladies in country zones. The organization depends on the Grameen Bank model and advances are progressed with an enthusiasm of 14%.
In any case, regardless of consistent endeavors by the administration, rustic cr alter confronts real hindrances, as portrayed by Pathak (2010). Factors, for example, the scattered low populace, uneven territory, low foundation advancement, low advance recuperation rate, high hazard and high overhead cost have reared the effect on the improvement of micro finance establishments in country zones of Bhutan. In 2010, under 44% of ranchers approached credit from balance uncial establishments, (this was out of an expected 87,500 homestead families), and this figure was impressively lower for littler agriculturists at around 10%. The nonattendance of other committed micro finance foundations and the peak smaller scale fund body in Bhutan being BDBL alone has altogether controlled the extent of micro finance in the nation. From the customers’ point of view, few loaning establishments bringing about constrained access to advances, long and antagonistic obtaining techniques, contract pre requisites notwithstanding for little credits, high financing cost structure, and so forth., has postured huge hardships in getting advances.
On the off chance that we consider ventures made by money related establishments in Bhutan by segments, agribusiness comes in eighth, with add up to speculation by monetary divisions (as advances), which is a pitiful 1.39% of aggregate venture (adding up to Nu. 36,005.02 million) in the year 2010 (from the Statistical Yearbook k of Bhutan 2011, National Statistics Bureau , RGoB). Taking a gander at the pattern over a time of years, the rate of assets given to agribusiness regarding credits by budgetary organizations has really diminished from 1.92% of every 2016 to 1.39% out of 2010.
In fact, of the ten biggest parts which represented more than 99% of the credits, the best five were individual, Building and Construction, Manufacturing, Trade and business, Service and
Personal Loans for Agriculture
The above diagram obviously demonstrates the carelessness and lack of concern towards farming part loaning by monetary establishments. In the year 2010, an aggregate of Nu.499.45 million was put by money related foundations in the agribusiness part. In the event that we consider the expansion in interest in agribusiness area, there has scarcely been an increment of more than 105% contrasted with five years prior (somewhat finished twofold). In the examination, individual credits have expanded about five times and, vehicle advances (for overwhelming vehicles) have expanded more than six times (Statistical Yearbook of Bhutan 2011, RGoB).
Of the credits given to horticulture division in 2010, 99.10% originated from BDBL. Just a little rate of the advances was given by Bank of Bhutan (0.60%) and T-Bank (0.30%). The loaning rate in horticulture segment (for advances rendered by budgetary organizations) was static at 13% in the vicinity of 2018 and 2010 (for a reimbursement time of 10 years), though in the ‘other traveler vehicles’ part, financing costs really descended from 14% (for reimbursement in 5 years) in 2018 to 12% (for reimbursement in 7 years) in 2010 (Statistical Yearbook of Bhutan 2011, RGoB).
A current overview directed in Samtse has demonstrated that micro finance customers in Bhutan apparently obtained Nu.30, 000 to Nu.50, 000, and paid an enthusiasm of 5 to 10 percent to Bhutanese moneylenders or, 3 to 10 percent to Indian moneylenders. This is really a little sum, and shouldn’t require security by any stretch of the imagination. Such credits can be effectively given by specific micro finance organizations and can truly go far in helping the agriculturists in the midst of need.
While the improvements in the rural segment have made expansion openings, there are imperatives that can hamper the capacity of agriculturists; particularly that dominant part of Bhutanese ranchers are poor and peripheral agriculturists. The absence of sufficient framework, restricted access to data, credit, and different resources (land, water, and mechanical know-how), can seriously compel the extent of broadening activities.
These boundaries, data holes, and limit confinements display an open door, as well as a requirement for specialists’ concerned (Ministries, offices, contributors) to offer help and help to manufacture the limit with respect to expert poor broadening exercises.
Expansion activities require a multi-segment approach including numerous particular venture ranges. Approach and institutional condition, water system and seepage, science and innovation, and country framework are only a couple of illustrations. Every one of these speculations won’t originated from the general population part.
For long haul arranging, government needs to make the empowering conditions for the private segment to give sources of info and administrations to ranchers important for enhancement; (FDIs), be that as it may, the administration needs to contribute to enlarge the extent of research establishments to cover rising issues of broadening, enhance the scientific capacities of agriculturists to blend the expansion opportunity, and build up the productive learning and data frameworks.
Besides wage era, broadening will, in many cases, increment work for the country poor. For instance, von Braun evaluates that because of broadening to send out vegetable creation in Guatemala, work expanded by 45 percent on members’ homesteads. It is normal that the advantages of expanded business openings are significant as well as are circulated over a wide range of the economy and in this way are to a substantial degree “expert poor.”
Ali and Abedullah (2012) exhibited the potential for country work era emerging from enhancement out of oats to high-esteem products, for example, vegetables, by looking at the work force in the two frameworks. Considerable business openings are created in seed and seedling generation, accuracy arrives planning, and the water system, collecting, cleaning, evaluating, and bundling of high-esteem crops.
It was evaluated that a one-hectare move of grain to vegetables in one season creates over one year round all day business (that is, the contrast amongst oats and vegetables was more than 220 working days for each hectare). The off-cultivate work impact of comparative greatness was anticipated through the extension in the farming business exercises. Joshi and Gulati et al. (2012) likewise detailed comparative outcomes.
Because of developing customer interest for exceedingly bundled and prepared horticultural items, enhancement ordinarily includes the development far from customary wares (requiring negligible auxiliary preparing) toward higher esteem products (requiring critical preparing and dealing with). Moreover, the new creation frameworks are regularly more concentrated and produce interest for a more prominent amount and an assortment of homestead inputs.
Since high-esteem crops, contrasted with oats, are all the more emphatically interlinked with different divisions of the economy regarding giving their yields and accepting contributions from these segments, there is a more grounded multiplier impact of the underlying increment in pay. For instance, it was evaluated that a unit increment in beginning salary in oats has a multiplier impact of two, while comparable increment in vegetables will create a multiplier impact of three (Ali and Abedullah 2012).
With the move far from subsistence harvests to more beneficial money crops like vegetables, comes back to arrive, work, manure, and water are fundamentally higher. The level of change in cultivating pay in the long and medium term will rely on the idea of relative changes in wage and use and in addition the degree of home utilization.
Country family units in Bhutan procuring the greater part of their salary from the generation of exportable merchandise will encounter a net welfare increase paying little mind to their utilization crate, while the effect for those families that are net customers might be vague, contingent upon the impact on nearby nourishment costs. Regardless, broadening will bring about more prominent nourishment security at the family unit level.
Given the above situation, the Royal Government should play a dynamic part in instigating manageable development by empowering economical generation frameworks in accordance with the accessible assets of agriculturists and micro environments of soil and land, catching on the regular focal points Bhutan has over its neighbors like India and Bangladesh. To advance the star poor enhancement with high-esteem crops, speculation ought to be coordinated to diminish yield change by creating stress-tolerant innovations and safe cultivars of these harvests and to enhance Homestead to showcase linkages.
In addition, approach advancements ought to animate market components to grow little ranchers’ association with the end goal of defeating the economies of scale issue and enhancing their entrance to business sectors and data. Preparing on little scale horticultural business improvement can likewise empower smallholder ranchers and landless destitute individuals to change.
With suitable arrangements, some of these speculations may originate from the private area, while venture identified with the foundation of makers’ association to enhance their capacity in investigating expansion openings and meeting the exploration needs identified with these open doors should originate from the general population private division joint effort. Delgado (a researcher at Agricultural field) perceived that there are three prerequisites for strategy level consolation of expansion.
In the first place, enhancement methodologies need to target staple sustenance generation and showcasing issues to such an extent that approaches accommodating more prominent nourishment security are composed and executed. Increments in high-esteem creation are not prone to happen unless nourishment security dangers are impressively brought down, especially with regards to Bhutan where at present a high offer of assets is given to subsistence sustenance generation.
Second, the exchange costs related with the stream of assets and items amongst areas and districts should be diminished. This is so picked up from the creation of surplus can stream to ranges delivering non-excess, which thusly are required to help the generation of surpluses.
Third, there is a need to advance non-conventional fares as a wellspring of remote trade to abroad markets. For example, comparative fare things along the lines of mushrooms, Cordyceps, apples, and oranges should be additionally broadened. This can be accomplished by putting resources into investigating, expansion, preparing and data frameworks of high-esteem crops, natural creation, restorative and sweet-smelling plants, and by creating the quality foundation. It requires supported endeavors to beat institutional and infrastructural limitations.
A further essential part of the administration is guaranteeing that ranchers have the ability to benefit from the innovative and market openings display in the outer condition. This type of maker strengthening requires sound instruction and expansion frameworks at all levels, and in addition meditation when important to conquer any boundaries to the stream of the market and specialized data and learning.
Decentralization (DYTs, GYTs) has made an instrument to encourage the procedure yet additionally fortifying of such bodies as far as overhauling know-how, and mindfulness is considered essential. The significance of giving the agriculturists a choice of choices for their generation ought to be perceived inside the projects and subprojects of vocal arranging.
The up and coming national nourishment security arrangements archive need to address both the nationwide generation and the neighborhood accessibility of sustenance in ranges with low efficiency as well as zones more suited for the creation of tradable products, for instance.
Wellbeing and sanitation must be elevated to completely abuse the welfare impacts of commercialization and expansion, and strategy should concentrate on preparing and work versatility programs on the grounds that “all things considered, the minimum diversifiable gift is most likely uneducated work” (Quiroz and Valdés 2011, p. 297).
Furthermore, ultimately, proper exchange arrangement is basic, particularly given that the nation has started participation to joining the World Trade Organization (WTO), openings are progressively fixing to the abuse of developing markets in remote nations.
Bhutan-Export Strategy, 2010, UNCTAD/WTO.Bhutan Trade Statistics Up To 30th June 2012, Department of Revenue & Customs, Royal Government of Bhutan.
Delgado, C. (2012) “Agricultural diversification and export promotion in sub-Saharan Africa.” Food policy, volume 34, number 7, pages 243-279.
Delgado, C. and A. Siamwalla (2012). “Rural economy and farm income diversification in developing countries.” In; Proceedings of the 23rd international conference of agricultural economists, August 2014, Sacramento, California. Pages 129-198.
Druk Seed Corporation, (2012) Strategic Options, Ministry of Agriculture, Paro.
Export Oriented Vegetable Production Proposal, (date unknown) Ministry of Agriculture.
Forest Resource Development Section, “Non-Wood Forestry Products, A Report on Thimphu & Paro Dzongkhags”.
Identification Mission for Agricultural Production Project/IPM Phase II Draft Report November 2013.
Joshi, P.K., A. Gulati, P. S. Birthal and L. Tewari. (2012). “Agriculture Diversification in South Asia: Patterns, Determinants, and Policy Implications”. RGoB, MoA-NCAP-IFPRI Workshop on “Agricultural Diversification in South Asia”. Paro, Bhutan. November 21-23, 2012. (paper and slide presentation) Policy, Strategies and Plans, October 2011. Engineering Division, DOA (9th Five Year Plan 2012-2017),.
Quiroz, J., and A. Valdés. (2015). “Agricultural diversification and policy reform”. Food Policy. Volume 44, Number 9, Pages 267-295
Renewable Natural Resources statistics, 2010, Ministry of Agriculture.
Renewable Natural Resources statistics, 2015, Ministry of Agriculture.
Renewable Natural Resources Section, 2012-2017, Ninth Five Year Plan Document, Ministry of Agriculture.
Statistical Year Book of Bhujtan, (2014). National Statistical Bureau, Royal Government of Bhutan.
Tobgay, Sonam (2015). “Small Farmers and Food Systems in Bhutan”. A paper presented at the FAO Symposium on Agricultural Commercialization and the Small Farmer, Rome.von Braun, J. (2015). “Agricultural Commercialization: Impacts on Income and Nutrition and Implications for Policy”.
Want help to write your Essay or Assignments? Click here.
Bank runs remain one of the major problems affecting banking development due to their impact on bank liquidity, which could lead to bankruptcy. Kaufman (1987) suggests that when a bank faces a credit decline and rumours of bankruptcy, people are afraid that banks cannot repay their deposits on time, such that a significant number of depositors withdraw cash at the same time in what is known as a bank run. This may lead a bank into a liquidity crisis, and eventually insolvency. According to the House of Commons Treasury Committee (2008) in 2007, the US subprime mortgage crisis led to the global financial crisis, and many financial markets around the world faced a decline in liquidity, a sharp reduction in interbank lending market, and a large volatility in money market interest rates. Many international financial institutions during the financial crisis went into bankruptcy, including Northern Rock Bank in the United Kingdom, which has more than 150 years of history (Shin, 2008). On the 14th of September 2007, Northern Rock faced liquidity shortages and rumors of the acquisition, which caused a large number of depositors to withdraw their cash and ultimately led to Northern Rock nationalization to prevent the bank run (Shin, 2008). A run on Northern Rock Bank became the iconic event of the US subprime mortgage crisis affecting the European financial industry.
Although in the current financial environment China’s banking system is relatively stable, because of the large share of government ownership, bank runs have also occurred. In June 1998, due to a run on the Hainan Development Bank, it was unable to repay its debts, the bank declared bankruptcy. Later on 23rd April 2014, there was a run on Jiangsu Sheyang local commercial bank, the local governments had to take urgent action to calm depositors’ panic on April 23, 2014 (Simon, 2014, ft.com). This incident also spread to the other local commercial banks. To prevent bank runs on March 31, 2015, China officially announced the “deposit insurance regulations.” The program, which officially took effect on May 1st, 2015, applies to all commercial banks, rural credit cooperatives and rural cooperative banks and other deposit taking institutions; except branches of Chinese banks overseas and foreign bank branches (Desai, 2016). The Bank of China is responsible for the implementation of the deposit insurance system (eDaily, 2015). However, China deposit insurance system is still in the preliminary stage and needs further development.
The characteristics of China’s financial institutions are similar to the Northern Rock Bank before the incident. In China, there is a rapid growth of real estate market, and therefore bank mortgage lending is growing very fast (Nanto, 2009). If the bank runs crisis occurs, a liquidity crisis could occur if there is no timely rescue from the Central Bank and the government.
Based on the case of the Northern Rock Bank run and the recent financial crisis resulting in the lack of liquidity, many countries (such as the UK, the US and China) implemented the deposit insurance system to avoid bank runs, which has important practical significance on the development of banking and the financial system stability in China.
This study focuses on analysing the overall deposit level of the banking sector in China and attempts to establish the impact of the deposit insurance system on commercial banks’ stability. The research will analyse the possible caused of a bank run in China, determine changes in risk-taking behaviour among banks and provide recommendations on the effective use of deposit insurance system to prevent bank runs.
On March 31, 2015, China officially announced the deposit insurance regulation, 20 years after the Chinese authorities first undertook the discussions (Desai, 2016). This was considered an imperative step towards stabilizing banks by making them more resilient to financial crises and preventing related occurrences such as bank runs and insolvency. The deposit insurance regulation would cover all deposit-taking institutions, from commercial banks to rural cooperative banks (Desai, 2016). It has been slightly over two years since the introduction of the deposit insurance requirement among banks in China, and the need to evaluate the impact of the regulation on banks’ performance is of the essence. Different perspectives have been put forward regarding the possibility of bank runs and how the use of deposit insurance could affect bank performance. Having delayed the adoption of DIS as other major economies adopted it following the 2007-08 economic crisis, China is finally in a position to deal with bank failures (Zhou, 2016). In this regard, the deposit insurance system is expected to have significant implications for China. These implications have not yet been studied since the introduction of deposit insurance regulations. Existing researches have only sought to determine the implications of deposit insurance but have not sought to compare bank performance in China following the regulation of deposit insurance. Therefore, there is need to examine the relationship between the deposit insurance system and the performance of banks in China, including their risk-taking behaviour following the introduction of deposit insurance. This research examines how deposit insurance has impacted the Chinese banking sector, by studying the implications of deposit insurance on the financial performance of banks and the occurrence of bank runs. It also studies the implications of deposit insurance on the risk-taking behaviour of banks in China with an objective of establishing whether deposit insurance has had an impact on China’s banking sector and the economy at large.
Deposit insurance became an important aspect of bank management following the financial crisis of 2007/2008. As a result, the deposit insurance system was introduced in order to avoid public panic and bank runs (Anginer, Demirguc-Kunt, & Zhu, 2014). Despite the perceived importance of deposit insurance, it is often argued that it could lead to moral hazard behaviour and contribute to risk-taking, thus fuelling another crisis altogether (Calomiris & Jaremski, 2016). Since its introduction, the issue of deposit insurance has been studied extensively. Mikajkova (2013) studied the role of deposit insurance in financial crisis establishing that it is instrumental in contributing to financial stability in countries. However, Chu (2011) examines banking stability in relation to banking insurance and argues that deposit insurance is not necessarily an optimal policy in eradicating bank runs. He suggests that this could be due to the moral hazard effect associated with deposit insurance and the fact that bank runs could be effective in creating elevated stability in the banking sector over time. Maysami & Sakellariou (2008) analyse deposit insurance and determine that despite the associated moral hazard, deposit insurance is highly effective in enhancing banking stability. Allen, Carletti, and Leonello (2011) and Ioannidou and Penas (2010) also study the impact of deposit insurance on risk-taking behaviours among banks, with an indication that deposit insurance automatically increases the risk-taking behaviour of banks. However, these studies and generally most of the literature largely focus on the developed economies, such as the US, the UK, and Europe. This can be due to the recent financial crisis and the resulting shortage of liquidity that led to a run on Northern Rock Bank. Literature in the developing countries is less common, and thus a significant gap in literature exists. Given that Deposit Insurance Scheme in China was introduced relatively recently, in March 2015, this makes this topic especially current and relevant to investigate. This study, therefore, will provide an important contribution to the literature by examining the deposit insurance scheme and reasons for bank runs in China over the most recent years from 2012 up until the first quarter of 2017. It will also contribute to literature through an assessment of the impact of deposit insurance on banks’ financial performance and risk-taking behaviour. These are important study aspects, and by conducting a research on major banks in China, it will be possible to relate the deposit insurance system with performance and risk-taking bahaviour, and compare the findings of this study with the previous literature on deposit insurance and its impact on the banking system.
This dissertation is divided into five chapters as follows:
Introduction
The introductory chapter provides a background to the research, introducing the main objectives of the research and the rationale for the research. It establishes the gap that exists in research and the contribution of this study to the existing knowledge.
Literature Review
This chapter examines the findings of the previous literature to establish the existing knowledge regarding bank runs and the impact of deposit insurance on bank stability and risk-taking behaviour.
Methodology
The methodology chapter informs the research design and approach used in obtaining data for the research. It provides information on the sources of data and discusses the data analysis method utilized to conduct the research
Results and analysis
This chapter consists of the findings of the research and thus provides the results of the study and answers to the research questions. This is achieved through analysis of the data collected and comparison with the findings from the previous studies.
Conclusion
The concluding chapter provides a summary of the dissertation, including the final findings from the research.
This chapter consists of a review of previous literature on the subject of bank runs. It includes research done on how bank runs occur, their implications and solutions that have been put forth to address the issue of bank runs. The chapter also includes a review of the literature on the use of deposit insurance as a means of curbing bank runs. The literature review chapter will not only provide background information about the subject of study, but it will also contribute to data analysis by providing a basis for comparison between the current research and previous researches.
Liquidity problems play a considerable role in driving financial crisis and is thus considered a one of the major causes of bank runs (Gertler & Kiyotaki, 2013). This explains why liquidity is an important factor in the banking sector and why liquidity mismatches could be detrimental to a bank’s survival (Gertler and Nobuhiro Kiyotaki, 2012). Liquidity and maturity transformation consists of the major business focus of banks, where longer-term assets (loans) are funded with short-term liabilities (deposits) (Gertler and Nobuhiro Kiyotaki, 2012). Maturity transformation, which is considered a primary cause of liquidity problems among banks, refers to the practice at which banks borrow money on shorter time frames than they give when lending out (Freixas, & Rochet, 2008). Banks may borrow on a short-term basis through short-term deposit certificates and demand deposits and lend on long-term such as through mortgages and other loans. This way, they transform short-term maturity debts into long-term maturity credits, thus gaining profit from the difference in interest rates. While this is profitable for banks, maturity transformation also poses considerable risks, such as the rise of short-term funding costs at a faster rate than the bank can recoup its gains from lending (Freixas, & Rochet, 2008). When there is an imbalance between asset maturity such as loans and liabilities maturity on a bank’s balance sheet, this may lead to liquidity issues, thus contributing to a bank’s financial stability in the event of a financial crisis (Gertler and Nobuhiro Kiyotaki, 2012). Choi and Zhou (2014) discuss liquidity mismatch as a result of liquidity transformation and explain that this was a major cause of the 2008 financial crisis. Liquidity mismatch could lead to reduced liquidity among banks and eventually low liquidity in the market (Brunnermeier & Pedersen, 2008). This explains why liquidity regulation has become an important measure in maintaining bank stability. Under Basel III for example, banks are required to maintain Tier 1 Capital of not less than 6% of risk weighted assets and Common Equity Tier 1 Capital of not less than 4.5% of risk weighted assets at any given time in order to enhance liquidity (Bank for International Settlements, 2010). While there is a consensus that liquidity is a major cause of concern which requires regulation, there seems to be no unanimity on how liquidity should be measured when establishing regulations (Bai, 2014).
Liquidity risk, therefore, becomes a widely studied aspect in the study of bank runs. Farag (2013) defines liquidity risk as the inability of a bank to meet its short-term financial obligations. This is most evident when the bank cannot effectively meet its obligations without having to convert its assets or without sacrificing its income or capital to pay debts. (Farag, 2013) As banks aim at leveraging the maturity mismatch between assets and liabilities, liquidity risk is inevitable when the bank is unable to pay its obligations. Liquidity risk may emerge as a result of excessive lending, such that in the event of default payments, the bank may not effectively manage its finances. When bank runs occur, liquidity risk is imminent because the withdrawal of deposits means that banks do not have adequate time to recover profits from loans in time to pay depositors, thus leading to bankruptcy.
A bank run is one of the traditional problems of commercial banks. Based on the harm of bank runs on deposits, banks and financial stability, scholars from various countries have put forward the measures, such as maintaining a reliable capital base, seeking alternative sources of liquidity, improvement of the information disclosure system, and the establishment of the risk early warning mechanism to prevent the run crisis and deposit insurance systems to prevent and deal with liquidity problems.
Diamond and Dybvig (1983) suggest that a bank run is a spontaneous and random phenomenon, bank runs can happen due to the inherent characteristics of banks, such as high asset-to-liability ratio, liquidity and maturity mismatches and following service principles. Diamond-Dybvig model was built based on the various bank runs affecting the world in the 1980s. Allen and Gale (1998) use the hypothesis of preference and technology in the D-D model to link the uncertainty of the return of bank assets with the industrial cycle. They believe that the industry cycle is the cause of bank panic. Chari and Jagannathan (1988) postulate that the bank run began due to depositors’ fears of bank insolvency. Jacklin and Bhattacharya (1988) suggest that due to the asymmetric information theory the bank cannot observe the real liquidity needs of depositors, and depositors do not know the quality of the bank’s assets, so the withdrawal of depositors depends on the choice of the bank’s return on risk assets.
Schumacher (2000) pointed out that Argentina’s bank run in 1994 was caused by deterioration in the fundamentals of the economy, and many banks in the economic crisis were more prone to bank runs. Ennis (2003) discusses a standard banking model that often appears in a variety of economic literature. Ennis (2003) assumes that the investment returns are stochastic. On this basis, he establishes a bank run model that is similar to the D-D model. Goldstein and Pauzner (2005) believe that asymmetry of information under the macroeconomic deterioration led to bank runs.
Macey (2006) points out those banks are susceptible to a run due to the bank’s inherent characteristics. He believes that banks tend to be unstable because depositors tend to rush to withdraw money under the “first come, first served” rule. If a big number of depositors require a large amount of cash urgently, they might attempt to withdraw their cash all at the same time, which can lead to a bank run.
A bank run can be a random or unpredictable characteristic, and therefore, it is necessary to establish a prevention mechanism in financial supervision. There are various measures to prevent bank runs, which include: the incorporation of the protection of the deposit insurance system, improvement of the information disclosure system, and the establishment of the risk early warning mechanism to prevent the run crisis.
The establishment of the deposit insurance system is an important part of the financial safety net (Pidm, 2017). Bryant (1980) argues that the deposit insurance system in the entire financial system has an irreplaceable role and that financial stability is pegged on effective deposit insurance mechanisms. Diamond and Dybvig (1983) using the D-D model of bank runs indicates that deposit insurance system provided by the government can prevent bank runs. Deposit insurance system establishes a firewall to protect the economy from the financial crisis by enhancing depositors’ security. This can also allow for an effective supervision of the financial institutions and protect the national economy from the financial crisis. Laeven (2004) indicates that the deposit insurance system not only protects the interests of depositors but also preserves the forces that can cause significant market volatility. However, a study by Anginer, Demirguc-Kunt, Zhu (2014) also finds that while deposit insurance can promote stability in financially turbulent times, it can also lead to the increased risk-taking behaviour of banks in normal times, known as the ‘moral hazard effect’ of deposit insurance. Their sample covers the publicly listed banks in 96 countries and the period that includes the recent financial crisis from 2004 to 2009.
Another measure to prevent a bank run is the establishment of a sound information disclosure system and early warning mechanism. Park (1991) pointed out that the lack of information is the main factor that can lead to a run on the bank. Therefore, to prevent the bank run, information is crucial for depositors to fully understand the condition of the banks, which can reduce the probability of bank runs. Yorulmazer (2003) pointed out that high-interest rate of the central banks may exacerbate banks liquidity problems, and therefore, the central bank should provide interest-free loans to bailout the banks in times of financial difficulties.
The deposit insurance system was first introduced in the United States in 1933, and the Federal Reserve Insurance Corporation (FDIC) was created by the United States under the Glass-Steagall Act of 1933 to provide deposit insurance for banks and non-bank financial institutions. After nearly 80 years of operation, FDIC effectively catered for deposit insurance maintaining the public confidence in the banking system. Since then, many countries, such as United Kingdom, Germany, Asia and China have established a deposit insurance system. However, while this system can enhance financial stability, it also has aspects to improve. The next sections discuss the advantages and disadvantages of a deposit insurance system.
Deposit insurance has been defined by Demirguc-Kunt, Kane & Laeven (2014)as the measures that are put in place by banks in many countries with the objective of protecting their depositors from any consequential losses that may arise from the bank’s inability to fulfill its financial obligations like paying the debt. This insurance is a component of financial system safety net that aims at promoting and enhancing financial stability (We, 2015).
Financial risks are a major concern for most banks, and therefore, these financial institutions are encouraged to invest most of the money in their deposit accounts as opposed to just safe-keeping the full amounts. Such investment risks include the failure of borrowers to repay, financial crisis, and over-reliance on customer deposits which can be withdrawn quickly in the event of possible insolvency (Mishkin, 2007). It is for these concerns that banks must develop and implement economic and monetary policies to increase the public confidence in the security of their finances. Deposit insurance institutions are principally run by the government in full or in partnership with the private sector. Many of these institutions are members of the International Association of Deposit Insurers (IADI). This is an umbrella organization that was established to ensure financial systems stability through contribution to and promotion of cooperation on the international level on matters relating to deposit insurer and related parties (Muhlnickel& Weib, 2015).
According to Anginer, Demirguc-Kunt & Zhu (2014), one implication that deposit insurance has on bank’s risk taking is the unintended consequence of a reduction in depositor incentive to monitor banks. This consequently leads to excessive risk taking and systemic fragility. This is usually the prevailing situation in the years that subsequently lead to global financial crisis. However, in the case of the global financial crisis, the countries, which had deposit insurance measure in place experienced, lower bank risk and more systemic stability than countries, which did not have such policies, implemented (Nanto, 2009). The overall effect of this insurance system on bank risk is negative, however, since the destabilization effect during the regular times is more magnified as opposed to the stabilization effect of economic turbulence (Anginer, Demirguc-Kunt & Zhu, 2014).
The net effect of deposit insurance on bank risk is dependent on whether its benefits to the bank, depositors and the economy at large, can outweigh its costs and negative impacts (Nanto, 2009). Positive impacts of these policies can be compounded by increased bank supervision by depositors and economic monitors. Proper and effective bank monitoring and evaluation can help to ensure and promote deposit insurance benefits during difficult economic periods and help mitigate its negative effects when normal economic periods are prevailing. By offering protection to the interests of the majority inexperienced depositors and correspondingly helping in the prevention of bank runs, deposit insurance policies can lead to enhanced social welfare and therefore reduced financial and bank risks. According to economic studies carried out, adopting deposit insurance is directly linked to decreased bank risk in the European Union (Gros & Schoenmaker, 2014). The positive impact of the insurance policy however can be overshadowed by the fact that banks can undertake excessive risks because they rely on the financial security it provides.
The uniqueness of debt management in the banking sector determines the inherent vulnerability of the banking system. In the game model of Diamond and Dybvig (1983), depositors have potential liquidity demands for bank deposits due to different risks. Also, bank runs are only made by an external factor or the result of irrelevant factors. In this respect, the government should be through the final lender mechanism for the timely shortage of liquidity in the bank to provide loans and should be through the establishment of deposit insurance system to prevent the information asymmetry caused by a bank run.
Chari and Jagannathan (1988) argue that bank runs are not entirely random events, but that the depositors are based on the rationality of negative information on bank solvency. When the depositors saw people standing in front of the bank waiting for a long team to withdraw money, they found that the bank had operational difficulties. In response to this phenomenon, strengthening the regulation of non-liquidity demand depositors, strengthening the confidence to continue to hold deposits, can effectively prevent a bank run. In 1992 Argentina abolished the deposit insurance system, but soon after that when Mexican financial crisis broke out in Argentina in 1995 they had to re-introduce the deposit insurance system (Miller, 1996). This example effectively demonstrates the importance of deposit insurance in maintaining economic stability through enhancing the performance of banks.
Cull et al. (2002), through empirical analysis of the data provided by the World Bank in more than a dozen countries, found that deposit insurance reduced the systemic risk of banks, and the explicit deposit insurance was superior to implicit deposit insurance in protecting a country’s financial Stability more effectively. When a financial institution is in crisis, the state can provide emergency relief. As Barth (1990) found, the Federal Deposit Insurance Corporation, with sufficient authority, was able to correct in the early years of a bad situation in a financial institution and could keep its troubled bank before it could endanger its national banking liquidity shut down.
Although the deposit insurance can help to improve the bank’s anti-risk ability, it also has disadvantages. The most important drawback of deposit insurance is that it can lead to moral hazard: the existence of deposit insurance makes bankers more inclined to pursue high-risk, high-yield, but do not have to bear the additional costs, but these costs passed on to the deposit insurance institutions, thus leading to the moral hazard (Zhou, 2016). This is particularly common where implicit insurance is provided by the government, such that the banks take advantage of the fact that any losses would be covered by insurance and not them, thus engaging in risky undertakings without caution (Kauko, 2014). Such moral hazard makes deposit insurance disadvantageous, and it could be potentially harmful to the economy if not well monitored (Kim, Kim & Han, 2014).
Financial institutions that pursue high-risk investments tend to pay higher interest rates to attract money. In the case of Iceland, which had a financial crisis in 2008, the Icelandic Savings Bank provided a dividend of up to 5.25 per cent for depositors, but the Dutch Cooperative Bank for the same period provided only a 3.4 per cent interest rate (Faure and Hu, 2013). This shows that deposit insurance by banks provides increased investor confidence because they are assured that insurance will cushion the financial risk. Accordingly, this encourages banks to pursue high- risk activities, which has a negative impact on the solvency of banks.
The second drawback of the deposit insurance system is that when its coverage is too broad, it will have a negative impact on the financial environment of a country (Calomiris & Jaremski, 2016). In times of financial crisis, deposit insurance is considered important in restoring depositor confidence, thus safeguarding liquidity and preventing bank runs (Zang, Cai, Dickinson & Kutan, 2015). However, when banks take advantage of this provision to increase their risk-taking behaviour, this could potentially lead to a crisis (OECD, 2017). Keeley (1990), found that deposit insurance, while increasing banking competition, also led to a decline in the concession value which led to an increase in bank defaults. Increasing and the decreasing capital adequacy ratio of deposit insurance arising from risky assets further increased the risk of bank management.
A third disadvantage is the deposit insurance system is the reduced likelihood of depositors being in a position to assess financial institutions at risk. Kaufman (1996) argues that due to the information hindrance deposit insurance places on depositors, banks should be subject to a system of regulated deposit insurance, which is not insured by a deposit above the quota and thus encourages large depositors to exercise effective supervision of financial institutions. This way, depositors can monitor banks and make decisions that ensure that their deposits are safe.
However, White (1996) argues that deposit insurance is not suitable for developing countries and countries with economies in transition because deposit insurance will bring negative incentives to depositors. When banks adopt deposit insurance, this creates an illusion of bank stability and depositors may be perceive a bank as being safer for their deposits as opposed to a bank with no insurance (White, 1996).
Vletter van Dort (2009), a corporate law expert, argues that the deposit insurance system provides financial consumers with a false signal that financial products are mistaken for money when they buy deposits as financial products. It can be seen that the idea of questioning the deposit insurance system has always existed, but it has rarely been put forward, but it is hoped that the defects and problems in the system will be found and perfected to promote the stable development of the banking industry.
In the practice of global banking regulation, the Basel Committee concluded that the financial safety net includes three major tools: administrative prudential regulation, the central bank lender of last resort, and the deposit insurance system (IADI, 2012). As one of the “three magic sins” of the financial safety net, the deposit insurance system played an important role in maintaining financial stability and protecting the interests of depositors (Schumacher, 2000). The deposit insurance system became more and more popular in the world, with only 20 countries established in 1980 and rapidly increasing to 87 countries by the year 2003 (Demirgüc-Kunt et al., 2008). According to the International Deposit Insurance Association (IADI), 113 countries and territories have established the deposit insurance scheme by the end of January 2014, and 41 countries (including China) were preparing to establish deposit insurance system. China implemented its deposit insurance regulations on March 31, 2015, and on May 1, the program took effect.
Before the deposit insurance system, China used the implicit deposit insurance system, where the Central Bank and the People’s Bank of China would implement the mandate of ‘lender of last resort,’ thus paying out consumer funds and debts for the failing institutions. This method while playing a role in maintaining financial stability was not reliable because depositors would not be certain as to how, when and whether they would be reimbursed, such that any rumour on bank failure would automatically lead to a bank run and thereby accelerated insolvency among affected banks (Zhou, 2016). Furthermore, this system only catered for big banks, and therefore smaller banks were at a disadvantage. With the explicit deposit insurance system, all banks have an opportunity to be competitive because they are also protected under the deposit insurance system (Wei, 2016).
There are many similarities with the Chinese deposit insurance and that of other countries regarding objective and design. However, the country’s specifics differ. Regarding membership, the program in China applies to all deposit issuing financial institutions, which include commercial banks, rural credit cooperatives, and cooperative banks. However, an exception exists which are foreign banks and Chinese banks overseas. This is in contrast to other countries like Korea and the Philippines, which extend the coverage of deposit insurance to foreign banks, and domestic countries with foreign branches (Demirguc-Kunt, Kane, & Laeven, 2015)
Another contrast between China and other countries exists in the covered deposits. In China, deposits denominated in RMB and foreign currencies are insured. Inter-bank deposits by financial institutions and deposits by senior managers in their institutions are exempted (Desai, 2016). It is not yet clear if structured deposits are insured in the country. All deposit insurance authorities in Asia except Singapore, Japan Thailand, and Vietnam cover foreign currency deposits. The coverage level for Chinese depositors is limited to a maximum of US$ 76,000 pay-out amount. This coverage level differs considerably among different countries. The payout amount ranges from US$ 1,472 in India to US$ 146,789 in Indonesia as a result of historical and circumstantial differences. Contrast also exists in the mode of governance in that the China’s Financial Stability Bureau of the People’s Bank of China is tasked with managing the deposit insurance. Hong Kong and Singapore have privately administered deposit insurance authorities. China is different from other countries in Asia since its deposit insurance systems are independent of the country’s Central bank. Other contrasting differences exist in the mandate and insurance premium of different countries.
Even though there are differences in the adoption of the deposit insurance scheme between the countries, China as one the late adopters of the scheme might face similar problems as other countries in the way that banks might take on excessive risk which can potentially harm their financial stability. It therefore makes China an important case to investigate whether banks risk and other financial characteristics differ before and after the implementation of the deposit insurance scheme. This study aims to examine the differences in bank performance and risk-taking behaviour before and after deposit insurance system.
Chapter Summary
Deposit insurance has been considered an effective measure in enhancing bank performance, and this can be explained by their ability to cushion banks from negative effects of low liquidity that accompany financial downturns (Yang, Chun & Xie, 2016). Deposit insurance helps banks to effectively engage in their activities without worrying about possible losses, thus making them more productive. However, deposit insurance is not always associated with positive outcomes, and it has been known to increase the risk-taking behaviour among banks, thus increasing their financial risk in the event of a financial crisis. According to Schich (2008), the Deposit Insurance System (DIS) is a financial safety net that will play an important role in protecting China’s financial infrastructure through preventing bank runs and enhancing depositor confidence. Deposit insurance also leads to moral hazard, which according to Zhou (2016) is catalysed by the fact that insurance gives banks liberty to chase higher risk investments in a bid to gain higher yields, knowing that insurance will cover them in case of failure. This chapter provides valuable literature review that will be useful in guiding the research.
Appropriate methodology can ensure that greater accuracy and reliability of results is achieved. This research utilizes quantitative research to conclude the impact of deposit insurance on bank performance, based on comprehensive analysis of data. To collect data for the research, financial information from the selected banks is utilized, which is then analysed using a paired-samples t-test to determine possible changes in financial performance following the introduction of deposit insurance. This chapter justifies the approach adopted by the researcher and thus discusses the methodological approach, the research sample, data collection, variable definitions and data analysis method.
There are two broad approaches to research, which include qualitative and quantitative analysis (Saunders, Lewis, and Thornhill, 2012). Qualitative research aims at understanding phenomena through explorative studies that seek to understand experiences, behaviour, opinions, attitudes, and beliefs of the targeted population (Saunders, Lewis, and Thornhill, 2012). This data is then used to interpret various meanings and understand issues associated with the target population. Therefore, the qualitative research investigates social meanings, processes, interpretations, relations, and symbols. Data collection methods in qualitative research are unstructured, and questions are mostly open-ended (Yin, 2012). Responses are thus varied and vast due to different views and opinions. Quantitative data, on the contrary, involves the use of statistics in understanding the subject under study, where data collected is analysed through the use of statistical tests to make conclusions about the study (Yin, 2012). In quantitative research, research is utilized in testing a theory, which can then be supported or rejected (Quimby, 2012). Data collection in quantitative research is more structured, and there is the tendency of utilizing closed-ended questions, thus generating patterned responses (Yin, 2013). Alternatively, secondary data may be collected through secondary sources such as books, journal articles, periodicals, reports, government publications and organizational records among others. In this study, data is collected from the banks’ financial reports. This study is based on the quantitative research methodology to examine the financial characteristics of banks before and after the introduction of the deposit insurance scheme in China. Quantitative research design is selected because of its ability to provide precise findings through statistical analysis, which will ensure that effective comparison can be conducted for the two periods (Yin, 2013).
There are two main reasoning in research: deduction and induction (Saunders, Lewis, and Thornhill, 2012). While the deductive technique moves from general to more specific hypotheses that can be tested, inductively begins with specific observations that lead to broader theories and generalizations. This study uses a deductive approach, whereby a theory is used to develop a hypothesis, and secondary data is used to test this hypothesis; ultimately confirming the original theory.
To obtain results from the research that can be generalized to other banks in the population, the sample for this study consists of the ten largest banks in China. The sample consists of the largest banks that are systematically important in China’s economy. These were selected based on their size, and the fact that the failure of these banks can estabilise the whole financial system in the country. It is therefore important to include these banks in the sample. The banks in the sample include three systemically important banks (SIBs) namely: Industrial and Commercial Bank of China, Agricultural Bank of China and Bank of China. Other banks include China Construction Bank, Bank of Communications, Shanghai Pudong Development Bank, China Minsheng Banking, China CITIC Bank, China Everbright Bank and China Merchants Bank.
The data for this study is collected from the financial reports of the banks included in the sample. This data consists of financial characteristics from the year 2012 to the first quarter of 2017. These years include the recent introduction of the deposit insurance system in March 2015 (Desai, 2016). To examine whether there is a difference in financial characteristics of banks before and after the introduction of Deposit Insurance, the study period is divided into two sub-periods: Before: 2012-2014 and After: 2015-2017. All data is collected for the year end, while data for 2017 includes data for the first quarter of 2017.
In examining the impact of deposit insurance on bank stability, there are a number of variables that demonstrate a bank’s financial characteristics including liquidity, asset quality, capital and profitability. Among these, capital and liquidity are considered among the most important characteristics due to their centrality to bank stability and solvency (Farag, 2013). According to Farag, banks are in a better position to sustain losses and prevent insolvency when they maintain a higher capital and a favourable liquidity position.
To effectively measure the financial position of banks, various variables are examined as follows.
Liquidity Ratio
In this research, liquidity ratio is represented by the loan-to-deposit ratio, which is considered a highly relevant measure of bank liquidity.
Loan/deposit ratio – This is a liquidity ratio that denotes the percentage of loans in a bank against total deposits. As a measure of the funding profile of banks, a high ratio of loans to deposits could be an indication of a risky funding profile (Farag, 2013). As the loan-deposit ratio increases, a bank’s risk of insolvency is increased due to its worsened liquidity position. The percentage of loans to deposits is calculated by dividing the number of loans with the total deposits held over the year as follows:
LDR = Total loans x 100
Total deposits
Asset Quality Ratio
The quality of bank loans to a great extent influence bank risk and the type of loans given by a bank are therefore an important bank stability indicator. In the process of lending, the risk of default is always eminent and this explains why the quality of bank loans is of great significance. While banks may charge a higher interest for loans that are riskier, it is also notable that borrower riskiness may change over time and this makes it difficult to predict the performance of loans (Farag, 2013). One way to measure loan quality is the ratio of nonperforming loans held by a bank, which is also an indicator of a bank’s risk-taking profile.
Nonperforming loan (NPL) – This refers to a loan that is either in default or almost by default. Non-performing loans may comprise of loans whose principal repayment is overdue beyond three months, loans whose instalments payments are overdue beyond six months, loans where the debtor has been prosecuted as a result of non-payment or loans whose interest repayment has been overdue beyond six months (cbc.gov). A high number of nonperforming loans could indicate poor performance and could potentially lead to bankruptcy (Sophastienphong & Kulathunga, 2010). However, it is notable that this figure may represent loans given before the deposit insurance was introduced, hence an indication of prior risk-taking behaviour. To calculate the ratio of non-performing loans, the amount of non-performing loans is expressed as a fraction of the total loans as follows:
NPL ratio = Non-performing loans
Total loans
Capital ratios
Capital plays a significant role in any bank by acting as a financial cushion against unexpected losses (Farag, 2013). The higher the capital a bank maintains, the more it can effectively absorb any losses the bank incurs. This means that capital has a direct influence on the bank’s stability or insolvency (Farag, 2013). It is however notable that by holding a large proportion of capital, banks may restrict their lending capability and thus reduce profitability (Kosmidou, 2008). In this research, capital is given significant consideration as a measure of bank performance and three measures of capital are incorporated as follows.
Tier 1 Capital (T1 Cap) – This measures the financial strength of banks and is considered a core measure of financial power. Tier 1 capital may consist of common stock, retained earnings and nonredeemable preferred stock among other core capital (Barth, Chen & Wihlborg, 2012). According To Basel III, Tier 1 Capital must not be less than 6% of risk weighted assets at any given time. Tier 1 Capital is calculated by adding Common Equity Tier 1 to additional Tier I (Bank for International Settlements, 2010). Additional Tier 1 capital may comprise of bank-issued instruments, stock surplus, instruments issued by consolidated subsidiaries of the bank and other regulatory adjustments (Bank of International Settlements, 2010). The formula for Tier 1 capital is given as follows:
T1 Cap = Common Equity Tier 1 + Additional capital.
Common Equity Tier 1 is defined below.
Common Equity Tier 1 (CET1) – This refers to the common stock that a bank holds. Introduced in 2014, the capital measure is a precautionary measure for protecting the economy by requiring banks to meet a specific CET1 ratio. (EBA, 2015). This is considered the highest quality capital and the ratio is similar to leverage ratio (Bank of England, 2014). According To Basel III, Tier 1 Capital must not be less than 4.5% of risk weighted assets at any given time (Bank for International Settlements, 2010). Common Equity Tier 1 is calculated as follows:
CET1 = common shares + stock surplus + retained earnings + other comprehensive
income and disclosed reserves + common shares issued by the bank’s consolidated subsidiaries + any regulatory adjustment in CET1 calculation.
Capital Adequacy Ratio (CAR) – This ratio is a measure of capital in a bank and is conveyed as a risk weighted credit exposure percentage (Sophastienphong & Kulathunga, 2010). To calculate the capital adequacy ratio, the formula is given as follows:
Capital adequacy ratio = Tier 1 Capital + Tier 2 Capital
Risk-Weighted Exposures
The Risk-weighted exposures refer to the weighted total of a bank’s credit exposures, such that high risk-weight exposure could be detrimental to the capital adequacy ratio, thus influencing the bank’s financial position (Bank for International Settlements, 2010).
The CAR seeks to ensure financial systems’ stability and efficiency and thus protect depositors. It measures tier 1 and tier 2 capital provided under Basel III to establish the degree to which the bank can withstand economic turmoil.
Profitability Ratio
Profitability remains an important indicator of bank performance. According to the risk-return trade-off hypothesis, higher risk may be linked to higher profitability (Kosmidou, 2008). Accordingly, this variable is considered highly significant in this study. Among the most commonly used profitability measures is return on equity which is discussed below.
Return on Equity (ROE) – This is considered an important profitability ratio and is used in measuring the proportion of income returned as equity for shareholders (Barth, Chen & Wihlborg, 2012). This ratio indicates how effectively a corporation can generate profit from what shareholders have invested. The formula for ROE is give as follows:
Return on Equity (ROE) = Net Income
Average total equity
The higher the ROE, the more effective a company is said to be in terms of using equity financing for net income generation (Barth, Chen & Wihlborg, 2012). An ROE of 1 for example would mean that one dollar is generated in net income for every dollar invested by stockholders. Based on the risk-return trade-off hypothesis, banks would gain higher profitability through increased risk. On the contrary, an increase in non-performing loans could affect income and thus reduce profitability (Kosmidou, 2008). In this respect, the relationship between risk taking behaviour and profitability may not always be straightforward.
The bank financial characteristics described above are used in examining whether there is a difference in bank risk profile before and after the introduction of deposit insurance scheme in China in March, 2015.
Data for this research is analysed using SPSS using Paired (Dependent) Samples T test. The dependent samples t-test is used in the comparison of means (e.g. financial characteristics) between two groups that are related (such as same entities at different time points) (Laerd Statistics 2017). In this research, the aim is to determine the influence of deposit insurance on bank stability in China. Accordingly, the samples are split into two sub-samples in a bid to compare bank performance between two economic periods, before and after the introduction of the deposit insurance scheme. The t-test is used in analysing the data between 2012 and 2014, and comparing it to data between 2015 and 2017; given that March 2015 is when the deposit insurance system was put in place.
This chapter describes the research methodology adopted for the research. A quantitative approach is adopted in conducting the research, where financial data from banks is used in the analysis. The 10 largest banks in China are selected for the collection of data. Information from their financial records including loan-to-deposit ratio, nonperforming loan ratios, Tier 1 Capital, Capital Adequacy Ratio, Return on Equity. To compare the periods before and after the deposit insurance, the dependent samples t-test is utilised. The research methodology attempts to ensure that accuracy of research is achieved and that the conclusions are reliable. In the next chapter, the results and data analysis are presented.
In this chapter, the results of the research and data analysis are presented. The analysis aimed to determine the impact of deposits insurance on banks’ performance and risk-taking behaviour, as indicated in the initial objectives of the research. The analysis first shows the descriptive statistics of the two related samples (bank characteristics before and after the DIS introduction). The following step is to conduct a paired samples t-test that attempts to compare the financial data of banks (liquidity, asset quality, capital and profit) before and after the deposits insurance was introduced.
Data from the 10 banks indicate a change in bank financial performance before and after the introduction of deposit insurance system in China. The results are illustrated through the various financial ratios as follows.
Risk-Taking Behaviour
Loan-to deposit ratio
The loan-to-deposit ratio among all the banks increased considerably from the year 2012 to 2017. This means that there was an upward trend both before and after the deposit insurance system. While the average loan to deposits in the year 2012 for all banks was at 70%, this increased to 78.46% in 2016 before dropping slightly to 78.4% in 2017. A time series showing the changes on liquidity before and after the introduction of deposit insurance in China is shown below.
Nonperforming loans
Overall, there was an increase in the number of non-performing loans, both before and after the introduction of deposit insurance system. It is however notable that the increase in non-performing loans was higher before the deposit insurance system, having increased by 47% between 2012 and 2014. On the contrary, the increase following the deposit insurance system between 2015 and 2017 was 3.09%. ABC had the highest value of non-performing loans in 2017, the last year of evaluation at 2.33% while BOC had the lowest value at 1.45%. The changes on non-performing loans before and after deposit insurance is illustrated below.
Bank Stability
Capital ratios
Capital is considered an important aspect in assessing bank performance. As illustrated in the graph below, Tier 1 Capital increased both before and after the deposit insurance system. The Tier 1 Capital increased by 5.6% while it increased by 1.53% after 2015 when the deposit insurance system was introduced. In calculating the Tier 1 Capital before the deposit insurance system, the comparison was done between 2013 and 2014 because data for Tier 1 Capital in 2012 was only available for one bank. Common Equity Tier 1, a significant measure of capital for banks increased gradually in the entire period of study. Before introduction of the deposit insurance CET1 increased by 12.02%. On the other hand, the capital measure in increased by 0.43%. Notably, the CET1 declined in 2016 from 6.96% in 2015 to 6.78%, before increasing again to 6.99%. The third capital ratio, Capital Adequacy Ratio showed an oscillating trend, with figures dropping in 2013 and 2016 while increasing in the other years. The percentage increase recorded in 2014 from 2012 was 1.03% while the increase recorded in 2017 from 2015 when the deposit insurance system was introduced was 1.39%.
Bank Performance
Profitability
Profit ratio was represented by return on equity (ROE), with the results indicating that the ratio fell following the introduction of the deposit insurance system. While the ROE was 21.82% in 2012, this fell considerably to 16.22% in 2017. The ROE fell by 14.52% between 2012 and 2014. Following the introduction of the deposit insurance system, in 2015, there was a 10% decrease in ROE in 2016 before the value returned to the 2015 figure.
The net profit for all the banks included in the research improved between 2015 and 2016, except for BOC whose profit dropped in 2016. The increase in profitability is an indication of better performance. In the graph shown below, the net profitability trend for each bank is shown, including the profit figures for each year.
Minimum and maximum statistics
The tables below represent the minimum and maximum statistics for the difference in the two samples including skewness and kurtosis. The paired sample t-test relies on the means determine the difference in the two time periods.
Table 1: Minimum and maximum statistics _before and after
Loan_Before
NPL_Before
CAR_Before
T1Cap_Before
CET1_Before
ROE_Before
Mean
0.7169
0.0100
0.1231
0.0970
0.0635
0.2037
Median
0.7272
0.0099
0.1233
0.0929
0.0643
0.2058
Standard Deviation
0.0613
0.0024
0.0130
0.0109
0.0071
0.0288
Kurtosis
0.0155
0.2693
-1.0241
0.0657
-0.6977
-0.3942
Skewness
-0.3362
-0.1183
0.3392
1.0287
-0.1150
0.1052
Minimum
0.5922
0.0043
0.1057
0.0845
0.0502
0.1487
Maximum
0.8516
0.0154
0.1486
0.1211
0.0751
0.2665
Count
30
30
25
21
30
30
Loan_After
NPL_After
CAR_After
T1Cap_After
CET1_After
ROE_After
Mean
0.7754
0.0166
0.1304
0.1045
0.0691
0.1567
Median
0.7713
0.0160
0.1313
0.1031
0.0679
0.1547
Standard Deviation
0.0665
0.0026
0.0134
0.0166
0.0080
0.0217
Kurtosis
0.5053
3.6620
-1.3388
-1.2314
-1.0973
-0.2382
Skewness
-0.4737
2.0577
0.1627
0.3480
-0.1297
0.2395
Minimum
0.6079
0.0143
0.1080
0.0821
0.0552
0.1210
Maximum
0.8979
0.0239
0.1539
0.1313
0.0816
0.2080
Count
30
30
30
30
30
30
Table 2: Minimum and maximum statistics differences
Loan Difference
NPL Difference
CAR Difference
T1 Difference
CET1 Difference
ROE Difference
Mean
-0.05856671
-0.006643333
-0.007768
-0.00682381
-0.005591479
0.047006667
Standard Error
0.006963001
0.000454674
0.001644027
0.002262162
0.001201778
0.004179696
Median
-0.056664579
-0.0065
-0.0079
-0.0056
-0.004383641
0.0484
Mode
#N/A
-0.005
-0.0074
#N/A
#N/A
#N/A
Standard Deviation
0.038137928
0.002490351
0.008220134
0.010366528
0.006582409
0.022893139
Sample Variance
0.001454502
6.20185E-06
6.75706E-05
0.000107465
4.33281E-05
0.000524096
Kurtosis
0.112380322
-0.786625554
-0.134794389
-0.389539097
-0.287957003
-0.696161547
Skewness
-0.294404758
-0.32884876
-0.205249729
-0.304232042
-0.319173151
-0.231661682
Range
0.172612788
0.0088
0.0327
0.0389
0.028148104
0.084
Minimum
-0.146529442
-0.0115
-0.0269
-0.028
-0.020571644
-0.0014
Maximum
0.026083346
-0.0027
0.0058
0.0109
0.00757646
0.0826
Sum
-1.757001298
-0.1993
-0.1942
-0.1433
-0.167744373
1.4102
Count
30
30
25
21
30
30
4.3 Impact of deposit insurance on China banks’ risk-taking behaviour
The results from the paired samples t-test show that Chinese banks have undergone changes from the introduction of deposit insurance as evidenced by the change in their risk-taking behaviour. Based on the data collected from the 10 banks, the variables change considerably over the years, and this can be interpreted as follows.
Loans to deposits ratio
Loan to deposits ratio is a measure of liquidity and the funding profile of banks, where the higher ratio indicates a riskier funding profile (Farag, 2013). The results show that the average figure increased significantly following the deposit insurance. While the average loan to deposits in the year 2012 was at 70%, this increased to 78.46% in 2016 before dropping slightly to 78.4% in 2017. The p value based on the paired t-test 0.00, a figure less than 0.05 and which shows a significant difference in the conditions before and after the deposit insurance. When the loans to deposits ratio are high, it is a manifestation of a risky funding profile (Farag, 2013). This insinuates that following the deposits insurance, the ratio of loans to deposits has increased, which indicates that banks’ risk propensity increased to a considerable level. According to Tan (2016), there is a lower risk of loss when insurance is present, and this reduces cautionary measures taken by banks such as limiting credit facilities and offering risky loans. This could be the case in China where the loans to deposits ratio have continued to increase following the introduction of deposit insurance. In a similar research, Calomitis & Jaremski (2016) established that in the presence of deposit insurance, firms were more risk-taking and used more of the deposits received to expand their lending. In this relation, the study associates such risk-taking behaviour with a possible increase in losses in the future.
Nonperforming loans
Non-performing loans increased from 0.83% in 2012 to 1.7% in 2017. The p value resulting from the paired t-test to compare the period before and after the introduction of deposit insurance in China is valued at 0.001. This can be directly related to the introduction of deposit insurance, which leads to higher risk-taking behaviour among banks. In a research by Ioannidou and Penas (2008), it was established that in the presence of deposit insurance, banks were more likely to engage in riskier lending, initiating loans to more risky borrowers. This group of borrowers has a higher chance of failing to pay back their loans and as banks lend more without paying attention to repayment risks, the probability of having increased non-performing loans is higher. Accordingly, it can be established that banks in China had a higher risk-taking behaviour in the period following the deposit insurance regulations. This corresponds with the findings by Ioannidou and Penas (2008) who establish that deposit insurance increased the risk appetite among banks, demonstrated in this research by the high number of non-performing loans recorded by the banks under study. When banks are assured of a back-up to protect their liquidity in the event of an economic downturn, they tend to exercise lesser caution in their lending activities, which can explain the high number of non-performing loans witnessed among banks in China. To a significant extent, however, it may be difficult to determine, based on the data whether all losses from non-performing loans were from loans taken after the introduction of the deposit insurance system. It is however difficult to establish whether the non-performing loans recorded are the result of riskier lending behaviour among banks because it is possible that some loans may have been given before the introduction of deposit insurance.
Capital Adequacy Ratio
CAR rose slightly over the years, from an average of 11.73% in 2013 to 13.17% in 2017. This would generally indicate availability of more capital for banks to cover their losses such as those resulting from non-performing loans, hence more resilience to risks. This is contrary to the expectation that deposit insurance introduction would lower capital ratios since banks would adopt riskier behaviour (Kim, Kim & Han, 2014). However, this can also be explained by the fact that banks are now required to maintain a higher Tier 1 capital to improve economic resilience. In China, the ratio for top banks is currently set at 11.1% and is expected to increase to 11.5% by 2018 to meet the Basel III requirements (cbrs.gov). Results from the t-test indicated that there was a significant difference in capital adequacy ratio after the introduction of the deposit insurance system (p value = 0.000). Capital adequacy ratio determines how well a bank can survive economic downturns and it is therefore evident that Chinese banks are in a better position to maintain their operations in case of economic crisis. A rising trend is an indication of enhanced financial stability, and as noted by Hull (2015), the capital adequacy ratio can indicate a bank’s financial strength based on the fact that the bank can handle its obligations more effectively in the event of financial difficulties.
Tier 1 Capital and Common Equity Tier 1
On average, the Tier 1 Capital increased from 9.29% to 10.60% in 2017 while Common Equity Tier 1 increased from 5.99% to 6.99% during the same period. The paired t-test results indicated a significant difference in Tier 1 Capital and Common Equity Tier 1 before and after the introduction of deposit insurance system. While the p-value for T1 Cap was 0.007, CET 1 was valued at 0.000. Both of these values are less than 0.05 and therefore an indication of a significant difference between the variables before the introduction of insurance deposit and after. This insinuates that deposit insurance could have improved the performance of banks in China based on their capital structure following the regulation. The values of T1 Capital of CET 1 increased considerably following the deposit insurance introduction. The increase may be associated with China’s requirements, which aims at reaching a Tier 1 capital adequacy ratio of 9.5% and a Common Equity Tier 1 capital ratio of 8.5% by 2018 (cbrc.gov). This is in order to meet Basel III requirements and also increase the resilience of banks against financial crisis. An implication of this for commercial banks in China is that they are in a better position to cushion them from insolvency in the event of a bank run. Hull (2015) notes that the increased requirements of Tier 1 Capital and Common Equity Tier 1 was aimed at increasing banks’ resilience to ensure that they can effectively go through financial challenges. Tier 1 Capital measures the financial strength of banks and is considered a core measure of financial power. This includes capital from a common stock, retained earnings and nonredeemable preferred stock among other core capital that may be used in redeeming a bank during financial turmoil (Bank of International Settlements, 2010, 2010). Common Equity Tier 1, on the other hand, is also an indication of financial strength and does the bank hold a capital measure that represents the common stock. Such capital may shield a bank from unexpected losses and insolvency and is thus considered a major capital strength for any bank. This means that banks may successfully avoid a bank run by using the capital and common equity, thus maintaining its financial position. The increase in Tier 1 Capital and Common Equity Tier 1 capital among Chinese banks may explain the absence of bank runs following the deposit insurance system in China.
Return on Equity
Return on equity is seen to decrease following the deposits insurance, an indication that bank performance may be deteriorating. While the average ROE for all banks as at 2012 and 2013 was 21.82% and 20.64 respectively, this dropped gradually to 14.57% in 2016 before improving to 16.22% in 2017. It is however notable that the net profits for all the ten banks increased during this period as shown in Appendix 1. The result of this study show that nonperforming loans increased over this time period and thus could have an impact on bank profitability. Therefore, increase in nonperforming loans and the requirement to maintain a higher Tier 1 Capital and Common Equity Tier 1, could have influenced the drop in ROE. The risk-return trade-off hypothesis suggests that as banks take higher risk, they are likely to record an increase in profitability (Kosmidou, 2008). On the contrary, Kosmidou (2008) notes that if nonperforming loans increase as a result of the risk-taking, a negative effect on bank income and thus reduce profitability to a considerable extent. This may explain the decrease in ROE following the introduction of the deposit insurance system. In addition, profitability may not be immediate due to time lag, such that a reduction in ROE is observed when it would be expected to be rising.
A further analysis of the ratio change patterns is done using the paired sample t-test. The test compares the bank ratios before and after the introduction of deposits insurance. Results in table 3 indicate a p-value of less than 0.05 for all the six pairs tested as shown in the figure below (sig. (2-tailed). When the p-value is less than 0.05, it is an indication that the existence of a certain condition could have led to changes in the results. In this case, there is evidence that the means of the variables of the two samples (before and after) are different, suggesting that the introduction of deposit insurance had an impact on the six variables included in the research. This means that all the variables changed following the deposit insurance requirement. It is however notable that the changes observed may not entirely be as a result of deposit insurance introduction, given that there are many factors influencing the variables. Higher requirement of capital for example could lead to a change in capital ratios rather than deposit insurance, hence the caution in data interpretation.
Table 3: Paired sample test before and after
Paired Samples Test
Paired Differences
t-test
Sig. (2-tailed)
Mean
Risk-taking behaviour
Pair 1
Loan_Before – Loan_After
-5.85667%
-8.411
.000
Pair 2
NPL_Before – NPL_After
-0.66433%
-14.611
.000
Financial stability
Pair 3
CAR_Before – CAR_After
-0.77680%
-4.725
.000
Pair 4
T1Cap_Before – T1Cap_After
-0.68238%
-3.016
.007
Pair 5
CET1_Before – CET1_After
-0.559148%
-4.653
.000
Performance/Profitability
Pair 6
ROE_Before – ROE_After
4.70067%
11.246
.000
Paired Samples Test
Paired Differences
t
Sig. (2-tailed)
Mean
Risk-taking behaviour
Pair 1
Loan_Before – Loan_After
-5.85667%
-8.411
.000
Pair 2
NPL_Before – NPL_After
-0.66433%
-14.611
.000
Financial stability
Pair 3
CAR_Before – CAR_After
-0.77680%
-4.725
.000
Pair 4
T1Cap_Before – T1Cap_After
-0.68238%
-3.016
.007
Pair 5
CET1_Before – CET1_After
-0.559148%
-4.653
.000
Performance/Profitability
Pair 6
ROE_Before – ROE_After
4.70067%
11.246
.000
Year-by-year comparison of means
One of the assumptions of the paired samples t test is that observations are independently and identically distributed (https://www.spss-tutorials.com/spss-paired-samples-t-test/). Since our sample includes same banks in different years, this assumption might not hold. Therefore other tests were performed but using two years only:
A year before (2014) and at the end of the year when DIS was introduced (2015);
A year before (2014) and one year after the event (2016).
A similar trend is observed in the paired test comparing 2014 and 2015, where the p-value from the paired sample test is less than 0.05. This means that there is evidence that the deposit insurance requirement had an impact on all the variables studied during the period.
Table 4: Paired sample test 2014-2015
Paired Samples Test
Paired Differences
t
Sig. (2-tailed)
Mean
Pair 1
Loan_2014 – Loan_2015
-2.10923%
-2.927
.017
Pair 2
NPLs_2014 – NPLs_2015
-0.40300%
-6.460
.000
Pair 3
CAR_2014 – CAR_2015
-0.25100%
-1.632
.137
Pair 4
T1Cap_2014 – T1Cap_2015
-0.44400%
-2.932
.017
Pair 5
CET_2014 – CET_2015
-0.248936%
-2.409
.039
Pair 6
ROE_2014 – ROE_2015
2.43600%
13.652
.000
In the 2014/2016 pair, however, the p-values are greater than 0.05 for capital adequacy ratio, Tier 1 capital and common equity tier 1 as indicated in the table below. This indicates that no significant difference was observed during these years as a result of the deposit insurance requirement. A further investigation into the variables reveals that there was a drop in the three variables in the year 2016 from the figure recorded in 2015, hence explaining the differences in t-test results. The difference in results between the 2014/2015 and 2014/2016 paired tests could be an indication that changes in the banking sector may not be consistent; implying that there are other forces in the economy which may have influenced bank performance besides deposit insurance.
Overall, the results from the tests show that the financial performance of banks was affected by the introduction of the deposit insurance system. The results indicate that there is a significant difference between variables before and after the introduction of the deposit insurance system in China. These are discussed in relation to literature as follows.
Liquidity
Liquidity is considered one of the main features that deposit insurance attempts to safeguard. The results of this research indicate that there was an increase in loans-to deposit ratio which represents liquidity following the introduction of deposit insurance system. This can be explained by an increase in risk-taking behaviour among banks as a result of deposit insurance introduction. Deposit insurance increases banks’ confidence to lend because they are assured of a back-up in the event of financial difficulties or a bank run (Allen, Carletti & Leonello, 2011). Similar studies have also established that the loan-to-deposit ratio is likely to increase after deposit insurance introduction. According to Kim, Kim & Han (2014), deposit insurance leads to advancement of more loans by banks due to the higher risk-taking behaviour. Banks are more confident in issuing loans because they are assured of support from insurance in the event of a bank run. This is also associated with moral hazard, where banks take risks knowing that insurance will shield them against risk (Allen, Carletti & Leonello, 2011). The higher the risk taken, the more profitability is expected through increased lending, which could explain banks’ behaviour following the introduction of deposit insurance system (Calomiris & Jaremski, 2016).
Asset Quality
The results of this study show that the nonperforming loans increased following the introduction of the deposit insurance system. This could be an indication of increased risk-taking among banks due to the security offered by deposit insurance. According to Ioannidou, VP & Penas (2010) and Anginer, D., Demirguc-Kunt & Zhu (2014), banks take greater risks when their deposits are insured more than when they are not. However, a major implication of enhanced risk-taking is an increase in non-performing loans, which impacts the quality of a bank’s assets. The higher the number of nonperforming loans, the higher the risk of dissolution in the event of financial crisis (Barth, JR., Chen, L & Wihlborg, 2012).
Capital
The results of the research show that capital among banks increased following the deposit insurance introduction. The expectation after the introduction of deposit insurance is that banks would take higher risk and thus advance more loans; thus decreasing the level of capital among banks (Bonfim & Kim, 2013). The explanation for such a change according to Barth, JR., Chen, L & Wihlborg (2012) is that when banks lend more, less capital is left to cater for any financial risks that may be anticipated, which generally puts banks at a greater risk. In this regard, deposit insurance is seen as a threat for bank capital if regulatory measures are not undertaken. The rising level of capital in this research can be explained by the regulatory measures put in place to protect bank capital under Basel III; including the Tier 1 Capital and Common Equity Tier 1 Capital (Bank of International Settlements, 2010). These two capitals are aimed at protecting banks from financial crisis by ensuring that banks can effectively cushion losses resulting from difficult economic times (Gomes, T & Khan, 2011). While there was an increase in capital, this may be more as a result of the regulations as opposed to the deposit insurance.
Profitability
The introduction of deposit insurance may influence profitability through the risk trade-off hypothesis as suggested by Kosmidou (2008), where banks increase their risk-taking, advance more loans and hence obtain increased profit. The results of this research however indicate that the return on equity, which represents profitability in the research reduced during the period of study. There are two explanations for this, with the first lying in the risk trade-off hypothesis, such that if the bank’s increased risk leads to higher nonperforming loans, the bank may end up making more losses. This could be the case for Chinese banks given the rising value of nonperforming loans. The second explanation could be a lag in profitability increase. Grant (2016) notes that introduction of a new strategy within an organization may not always yield immediate profitability and may take time to adjust. In this case, the deposit insurance system was introduced in 2015 and profitability adjustments may still be taking place.
This chapter describes the results of the research, thus answering the research questions that it sought to answer. The analysis is done using SPSS, specifically the use of paired t-test in answering three questions as follows: Has deposit insurance reduced the number of bank runs in China? How deposit insurance enhanced the financial stability of Chinese banks? The results determine that during the period of research, none of the ten banks included in the research had a bank run. Also, there was only one potential bank run that did not materialize, which was as a result of false rumors, an indication that deposit insurance regulation is effective in reducing the possibility of bank runs in China. The results also indicate that bank performance has increased and that the risk-taking behavior among banks has also increased. These results are based on the paired t-test, which indicates that there is a significant difference between the study variables in the period before and after the introduction of deposit insurance. The analysis chapter is the basis for the research conclusion, and the findings demonstrate the outcome of the research.
Bank runs are considered among the various impacts of financial crises, and which have the potential to lead to bank insolvency as customers rush to withdraw their savings within a short period. Following the financial crisis of 2007/08, a significant number of countries adopted the deposit insurance system as a means of safeguarding banks in the event of financial crisis. This research sough to determine the impact of deposit insurance introduction on banks in China, by comparing the period before and after introduction of the deposit insurance system. To achieve this, data from top 10 banks in China was collected and analysed based on various variables namely liquidity, asset quality, capital and profitability. Under each variable, different indicators were used to determine whether there was a difference in the variables before and after the introduction of the insurance deposit system. The results were analysed using SPSS software, through the paired sample t-test.
This research establishes that deposit insurance plays a role in influencing the risk-taking behaviour of banks. This was observed through an increase in loan-to-deposit ratio, higher non-performing loans and lower return on equity. As evident in existing literature, deposit insurance leads to an increase in risk-taking among banks, which in return leads to increased lending with higher risk. As the number of nonperforming loans increase, the company has to sustain more losses and this means that their profitability is likely to reduce. The ratio of loans to deposits has increased over time, and this is a demonstration for increased risk appetite among banks. This can be associated with the assurance that deposit insurance offers, such that banks are more likely to engage in high-risk lending without fear of failure. A high loans to deposits ratio indicates a risky position for banks and this could potentially lead to insolvency. The increase in some non-performing loans is also an indication of the heightened risk-taking behaviour among banks in China following the deposit insurance system introduction. When banks increasingly lend to risky borrowers, they risk the possibility of high default rates, and this could compromise their financial position.
The level of capital held by banks has also increased considerably, and this increases their resilience in the event of a financial downturn. This means that banks in China are in a better position to survive and avoid bank runs. The deposit insurance system however may not be directly related to the increase in capital, which is considered to be the result of Basel III regulations which require banks to increase their capital level in order to effectively survive economic crises. The results of this study resonate with previous researches such as Allen, Carletti & Leonello (2011), Zang, Cai, Dickinson & Kutan Zhou (2016), Otgonshar & Otgonshar (2013) and Ioannidou & Penas (2010) who study the impact of deposit insurance and determine various implications including enhanced financial performance of banks, reduced likelihood of bank runs and increased risk taking behaviour among banks. The findings are not only true in other regions, but this research also establishes that these are some of the implications of deposit insurance in China.
This research has significant implications on banks in China, the China government and other countries seeking to adopt the deposit insurance system. The results of the study provide imperative conclusions about the effect of deposit insurance system among banks in China. These can be used by featured banks to keep track of the changes in their indicators in order to ensure that they moderate their risk-taking. A comparison of the variables with other banks can provide valuable information for banks to determine their competitive position. The government can use the results of the study to determine the impact of the deposit insurance system and thus determine whether it is yielding the intended results. This would help in developing measures to prevent any adverse effects. An example is the high risk taking behaviour of banks and consequent moral hazard, which could potentially lead to increased financial risk among banks through nonperforming loans. This could be addressed by setting a minimum lending rate to prevent high risk loans. Other governments could learn from significantly from this research through understanding the implications of the deposit insurance system and how it can help in promoting bank stability.
This research makes use of the top 10 banks in China and while they provide adequate information to answer the research questions, they are a relatively small sample and may not be a representative of the entire population. This is mostly so because there are no small banks included in the research. The recommendation for future studies is to increase the sample size and also include banks of various sizes.
The paired sample t-test determines that there is a difference in the means of financial characteristics of the banks included in the research. It is however notable that the ratios analysed are subject to influence by other factors within the economic environment. This means that some variables may have been influenced by other factors other than deposit insurance system; which makes it difficult to determine whether the results were an effect of deposit insurance introduction or other factors. An example is the Basel III regulations in capital, which could be responsible for an increase in capital between the two time periods. To counter this, future researches could implement more advanced techniques such as regression analysis where dependent variable could be probability to default. The researched could also include other ratios such as liquidity coverage ratio in measuring risk-taking behaviour.
In conclusion, the deposit insurance in China has had a considerable impact on banks regarding performance, bank run avoidance and risk taking. The research effectively establishes that banks have improved their performance as indicated by the increased profitability. Regarding bank runs, China has not experienced any major bank run in the recent past and the absence of bank runs following the introduction of deposit insurance is an indication that banks are maintaining a sustainable financial position. It could insinuate that banks have benefited from deposit insurance over the years, which has prevented them from undergoing financial difficulties. About risk taking, the higher propensity for risky lending among banks is apparent as indicated by the increase in the ratio of loans to deposits and the high number of non-performing loans possessed by the banks. The research, however, establishes that while deposit insurance may have influenced changes in the variables studied, other factors in the business environment including market changes, increased costs, changes in demand for loan facilities and other regulations may have impacted some of the changes witnessed. The increase in reserve capital, for example, is also influenced by the government’s requirement for banks to maintain a standard Tier 1 capital and common equity tier 1 capital. Overall, the introduction of the deposit insurance system has played a key role in enhancing the financial stability of banks in China and could be highly effective in preventing bank runs. On the contrary, an increased propensity for risk-taking based on the existence of insurance may result in instability in the banking sector and thus lead to potential bank runs in the future if not effectively checked.
Chari, V V., Jagannathan, R 1988, Banking panics, information, and rational
expectations equilibrium. The Journal of Finance,43(3), pp.749–761.
Chari, V. V., & Jagannathan, R. (1988). Banking panics, information, and
rational expectations equilibrium. The Journal of Finance, 43(3), 749-761.
Choi, D. B & Zhou, L 2014, The Liquidity Stress Ratio: Measuring Liquidity
Mismatch on Banks’ Balance Sheets, Retrieved from libertystreeteconomics.newyorkfed.org/2014/04/the-liquidity-stress-ratio-measuring-liquidity-mismatch-on-banks-balance-sheets.html
Crbc 2017, Capital rules for commercial banks. Retrieved from
Faure, M & Hu, J 2013, Towards a deposit guarantee insurance in China?
Law and economics perspective. The Chinese Journal of Comparative Law, 1(2), 256-288.
Federal Reserve bank of San Francisco 2016, A Regional Comparison of
China’s New Deposit Insurance System [online]. [Accessed 7 January 2017]. Available at:<http://www.frbsf.org/banking/asia-program/pacific-exchange-blog/regional-comparison-chinas-new-deposit-insurance-system/>.
Freixas, X, and Rochet, J-C 2008, Microeconomics of banking, MIT Press
Books, second edition.
Gertler, M & Kiyotaki, N 2013, Banking, Liquidity, and Bank Runs in an InÖnite
Goodwin, CJ 2009, Research in psychology: Methods and design. John Wiley
& Sons.
Grant, RM 2016, Contemporary Strategy Analysis: text and cases, 9th
edn. Chichester, Wiley & Sons.
Gros, D., & Schoenmaker, D. (2014). European Deposit Insurance and
Resolution in the Banking Union. JCMS: Journal of Common Market Studies, 52(3), 529-546. Wiley Library.
House of Commons Treasury Committee. (2008) Banking crisis: dealing with
the failure of the UK banks. Seventh report of the session, 9.
International Association of Deposit Insurers (IADI) ,2012.“2011 /2012
Annual Report”, Bank for International Settlements Communications,Basel,Switzerland.
Ioannidou, VP & Penas, MF 2010, ‘Deposit insurance and bank risk-taking:
Evidence from internal loan ratings’, Journal of Financial Intermediation, 19, 1, pp. 95-115.
Jacklin, CJ., Bhattacharya, S 1988, Distinguishing panics and information-
Based bank runs Welfare and policy implications, The Journal of Political Economy, 96(3), pp.568-592.
Kaufman, GG 1996, Bank failures, systemic risk, and bank regulation. Cato
J., 16, 17.
Kauko, K 2014. Do bailouts cause moral hazards or franchise value in
banking? Kyklos 67 (1), 82–92
Keeley, MC 1990, Deposit insurance, risk, and market power in banking. The
American Economic Review, 1183-1200.
Kim, I., Kim, I & Han, Y 2014, Deposit insurance, banks’ moral hazard, and
regulation: evidence from the ASEAN countries and Korea. Emerging Markets Finance and Trade 50 (6), 56–71.
Kosmidou, K 2008, The determinants of banks’ profits in Greece during the period of
EU financial integration, Managerial Finance, 34, 3, pp. 146-159. Retrieved from https://eclass.teicrete.gr/modules/document/file.php/DA171/Assignment%20Examples/Banks%20Profitability/Kosmidou_2008.pdf
Laerd Statistics 2017, Dependent T-Test using SPSS Statistics. Retrieved
Laeven, L 2004, The political economy of deposit insurance. Journal of
Financial Services Research, 26(3), pp.201-224.
Louzis, DP., Vouldis, AT Metaxas, VL 2012. Macroeconomic and bank-
Specific determinants of non-performing loans in Greece: a comparative study of mortgage, business, and consumer loan portfolios. Journal of Banking & Finance 36, 1012–1027
Macey, JR 2006, Commercial banking and democracy: The illusive quest for
deregulation, Yale Journal on Regulation, 23,1, pp.1-26.
Miaomiao, L 2016, ‘Discussion on the Trend of China’s Commercial Banks
Management: Based on the Influence of Financial Market Development,’ Modern Economy, 2016, 7, 833-840.
Miller, GP 1996, Is deposit insurance inevitable? Lessons from
Argentina. International Review of Law and Economics, 16,2, pp. 211-232.
Mishkin, F 2007, The economics of money, banking, and financial markets,
Pearson Education.
Muhlnickel, j., & Weib, G. N. (2015). Consolidation and Systematic Risk in the
International Insurance Industry. Journal of Financial Stability, 18, 187-202.
Nanto, DK 2009, The global financial crisis: Analysis and policy implications,
Diane Publishing.
Quimby, E 2012, Doing Qualitative Community Research: Lessons for Faculty,
Students and the Community, UAE: Bentham Science Publishers.
Saunders, M.N.K., Lewis, P. and Thornhill, A. (2012) Research methods for
business students. 6th ed. Harlow, England: Financial Times Prentice Hall.
Schich, S 2008, Financial Crisis: Deposit Insurance and Related Financial
Want help to write your Essay or Assignments? Click here.