Statistics: Scatterplots
Question 1
Scatterplots have been ranked as one of the oldest and most common techniques for projecting high dimensional data to 2-dimensional form. Generally, these projections are arranged in a grid structure to aid the user in remembering the dimensions linked with each projection. Scatterplots have proven to be quite useful in determining the relationship between two variables.
Scatterplots have been linked with a number of benefits. For instance, the plots have been cited as one of the most important technique for studying non-linear pattern. Krzywinski & Altman (2014) state that it is easy to plot the diagram. It is also useful in indicating the range of data flow, that is, the minimum and maximum value. Observation and reading of data in scatterplots is also straightforward.
Scatterplots are also important in studying large data quantities and make it easier to see the relationship between variables and their clustering effects. The use of scatterplots is an invaluable which is also useful in analyzing continuous data. However, this technique has a number of shortcomings such as being restricted generally to orthogonal views as well as challenges in projecting the relationship that exists in more two dimensions.
Question 2
When determining the appropriateness of the inferential statistical techniques, the researcher should first know if his/her data is arranged in a nested or crossed manner. If data is in a crossed manner, all study groups should have all intervention aspects. However, in a nested arrangement each study group will be subjected to a different variable. The correlation of variables can also be used in determining the appropriateness of a technique.
If the two variables have a linear or closely related association, the technique is said to be suitable. The number of assumptions that are employed when using a technique are also useful indicators. For instance, some techniques such as the t-test have several assumptions compared to the ANOVA technique, this implies that t-test has a large room for study errors unlike the ANOVA test.
Question 3
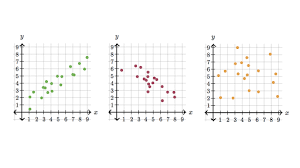
The Pearson product-moment correlation coefficient (PPMCC) is an analytical technique that is applied in indicating the strength of a linear association between two variables. This technique indicates a line of best fit through the data of two variables. It takes values ranging from +1 to -1 whereby a value of zero indicates that two variables of study do not have any association.
Values that are less than zero indicate that the two study variables have a negative association such that when one value increases the other one decreases. On the other hand, values that are greater than zero indicate that they have a positive association between them, that is, when there is an increase in one value, the other value increases as well. To determine whether the two variables have a linear relationship, they are fist plotted on a graph followed by a visual inspection of the shape of the graph.
A section of some scholars used to argue that PMCC can be used to indicate the gradient of a line. However, recent studies have dismissed this claim. For instance, Puth, Neuhäuser & Ruxton (2014) illustrate clearly that a coefficient of +1 does not mean that when one variable increases by one unit the other one increases by the same margin. A coefficient of +1 means that no variation exists between the plots and the line of best fit.
A number of assumptions must be put into consideration by analysts when they use the PPMCC. For instance, it is assumed that the outliers are either maintain at a minimum or removed completely. However, this is not the case in majority of studies. Another assumption is that the variables used should be distributed approximately normally and they must either be ratio or interval measurements.
References
Krzywinski, M., & Altman, N. (2014). Points of significance: visualizing samples with box plots. Nature methods, 11(2), 119-120.
Puth, M. T., Neuhäuser, M., & Ruxton, G. D. (2014). Effective use of Pearson’s product–moment correlation coefficient. Animal Behaviour, 93, 183-189.
Want help to write your Essay or Assignments? Click here