
Want help to write your Essay or Assignments? Click here
Statistics in Prediction of Outcome
Introduction
Statistic can be used to predict outcome. This is because statistic encompasses the use of various techniques that enable a person in prediction of outcome. To emphasize this fact, we carried out a project. Our project was about analyzing data to extend where we answer the research question. The topic was chosen because there is need to understand the relationship between statistic and outcome. We wanted to come up with proper understanding of the reliability of statistic in prediction of outcome. The research question was ‘can statistic predict income?’
Saint Leo University has excellence as one of the core values. The excellence that the University dreams of is about creating character that enables each one of the students to end up responsible people in the society. This is brought about by team work, dedication and completion of assigned tasks. Therefore, completing this project reflected what the value of excellence at Saint Leo University advocates.
Data
The data that we used is secondary. The data used in this report was obtained from the website of Halliburton Limited, a multinational company operating in the oil fields service providers industry.
This data covers a period of 3 years, from the year 2012 to 2014 and was obtained from http://ir.halliburton.com/phoenix.zhtml?node-id=huzgm7u7&c=67605&p=irol-reportsOther
Variables
In this project, we used dependent and independent variables. Dependent variables are the ones that a researcher is always interested in. On the other hand, the independent variables are the ones that affect the dependent variables.
Want help to write your Essay or Assignments? Click here
Dependent and independent variables
In our project, the dependent variables consist of operating income for three years. On the other hand, the independent variables consist of sales values for three years. According to Halliburton (2014), the sales and operating income values were as below.
| Year | Sales (x) | Profit(y) |
| 2012 | 28,503.00 | 4,159.00 |
| 2013 | 29,402.00 | 3,138.00 |
| 2014 | 32,870.00 | 5,097.00 |
Descriptive Statistics Table
| Statistic | Sales (x) | Profit(y) |
| Mean | 30,258.33 | 4,131.33 |
| Median | 29,402.00 | 4,159.00 |
| Min | 28,503.00 | 3,138.00 |
| Max | 32,870.00 | 5,097.00 |
| Standard Deviation | 1882.84 | 799.998 |
| Skewness | 1.36 | 0.10 |
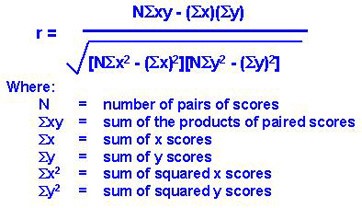
Statistic Test
The testing that we carried out is Pearson coefficient of correlation. This test is quite useful in understanding the relationship of variables. It is very useful in understanding how strong the relationship between variables is.
| Year | Sales (x) | Operating Income (y) | (xy) | (x^2) | (y^2) |
| 2014 | 32,870.00 | 5,097.00 | 167,538,390.00 | 1,080,436,900.00 | 25,979,409.00 |
| 2013 | 29,402.00 | 3,138.00 | 92,263,476.00 | 864,477,604.00 | 9,847,044.00 |
| 2012 | 28,503.00 | 4,159.00 | 118,543,977.00 | 812,421,009.00 | 17,297,281.00 |
| Total | 90,775.00 | 12,394.00 | 378,345,843.00 | 2,757,335,513.00 | 53,123,734.00 |
The formulae of Pearson Coefficient of correlation is as shown below
| N | 3.00 |
| N∑xy | 1,135,037,529.00 |
| ∑x∑y | 1,125,065,350.00 |
| N∑x^2) | 8,272,006,539.00 |
| ∑x^2) | 2,757,335,513.00 |
| N∑y^2) | 159,371,202.00 |
| ∑y^2) | 53,123,734.00 |
Coefficient of correlation (r) = 1,135,037,529.00-1,125,065,350.00/ Square root of (8,272,006,539.00-2,757,335,513.00)( 159,371,202.00- 53,123,734.00)
= 9,972,179 / 292,959,920,000,000,000.00
Coefficient of correlation (r) = 0.00000000003
After conducting Pearson coefficient of correlation, the result was a positive correlation of the variables. This means that when sales increase, the operating income increases too. This shows that we can predict the outcome of the year 2015.
Conclusion
From the project, it is evident that statistic can be used to predict outcome. Therefore, the research question has been addressed well. From the analysis, it has become evident that the use of statistic is faced with certain challenges. Firstly, reliability of some data sources is questionable. Additionally, the fact that data is not readily available is another challenge. There has also been an important observation that the choice of variables should be done properly to avoid confusion of the tests carried out. From the project, it has come out clearly that when there is positive correlation of variables, the movement of change in any of them is positive.
References
Halliburton (2014), Hallinurton, Retrieved from http://ir.halliburton.com/phoenix.zhtml?node-id=huzgm7u7&c=67605&p=irol-reportsOther Last Accessed 19th April, 2016
Want help to write your Essay or Assignments? Click here