Want help to write your Essay or Assignments? Click here
Macroeconomic Issues
Order Instructions: I want you to write and upload your analysis of what are the key macroeconomic issues for 2018 in the US and in Europe. Discuss the 5 below in a paragraph for each.
Five critical issues for 2018 macroeconomics are said to be: 1. tax reform shake out (Will Federal Reform work, what happens to State taxes?) 2. Can reduction in international imports to the US, raise US Exports and reignite the US GDP (Will bilateral trade agreements work to lower the trade deficit? Should it?); 3. Will Brexit cause or create Europe to grow faster? 4. Will capital formation and growth continue to reduce return to wages and increase inequality? (Will there be an increase in the productivity of labor or will it help increase wages or jobs?) 5. Other- You decide. Explain why you include this. It may be a country, a region or an economic category As the above 4.)
Below is a partial answer to the above homework questions by one of our writers. If you are interested in a custom non plagiarized top quality answer, click order now to place your order.
Macroeconomic Issues Essay
Tax reform shake out
The tax reform shake out refers to the congressional battle to sway votes to either support or reject the proposed reforms. The reforms constitute a number of proposals from a 2016 blueprint report from the US Congress as well as the one page plan revealed by the US President in April 2017. The reforms include a reduction in marginal tax rates, expanding support for childcare, rescinding alternative minimum tax, and eliminating various deductions (O’Brien, 2017; Speaker Paul Ryan, 2016).
The tax reform could work since it is a pertinent bill that affects the lives and incomes of the majority of low to medium income earners in the country. The impacts of the reform on state taxes include a broadening of the downward flow of revenue, expansion of the tax base, and uniformity in the conformity by different states (Griffith, 2017; Kaeding & Pomerleau, 2017).
International imports to the US and bilateral trade agreements
In the attempt to correct the trade deficit, reducing the level of international imports to the US would not be the most effective approach to solving the issue. As a rebate, the trade partners might reduce their purchases from the US and lead to increased deficits. As such, a worthwhile approach would be the use of bilateral trade agreements with important trade allies such as China and Germany.
Such agreements ensure there is continued trade and sets quotas of operation where each country has a given level of exports and imports it has to provide (McTeer, 2013; Baumohl, 2012). Therefore, the bilateral agreements can help to lower the trade deficit….
Want help to write your Essay or Assignments? Click here
Want help to write your Essay or Assignments? Click here
Company Performance Analysis
ORDER INSTRUCTIONS:
Please read the cases 10 and 12 and answer the following questions
Assignment of case 10
1) Review the two exhibits for Lowe’s & Home Depot (Exhibit 7 and 8). Examine ratios. See the excel file of case 10.
Prepare ratios for Lowe’s, using data from exhibit #5, which should be identical to those in exhibit 7 modeled by Home Depot. See below:
Fiscal year
1997
1998
1999
2000
2001
Working capital (CA-NIBCL*)
Fixed assets
Total capital
Tax rate
NOPAT (EBIT*(1-t))
Return on capital (NOPAT/Total capital)
Return on equity (Net earnings/S. Equity)
Gross margin (Gross profit/Sales)
Cash operating expenses/Sales
Depreciation/Sales
Depreciation/P&E
Operating margin (EBIT/Sales)
NOPAT margin (NOPAT/Sales)
Total capital turnover (Sales/Total capital)
P&E turnover (Sales/P&E)
Working capital turnover (Sales/WC)
Receivable turnover (Sales/AR)
Inventory turnover (COGS/M. inventory)
Sales per store ($ millions)
Sales per sq foot ($)
Sales per transaction ($)
Total sales growth
Sales growth for existing stores
Growth in new stores
Growth in sq footage per store
Total Capital/Equity
Which firm is the better performing one? On what basis do you conclude the better performance?
2) Who deserves the “Management of the Year” award in the retail building-supply industry? Compare based on 2001 firm performance.
Conduct DuPont analysis for both two firms and analyze their return sources?ROE=(NI/sale)*(sale/total capital)*(total capital/total equity)
*Prepare a DuPont analysis to evaluate the differences in performance?
Why the two firms have the same beta (exhibit 3), but the WACC are different?
Compare the two firms’ return on capital in 2011.
According to ROC, which one is better?
Consider their WACC.
Which firm’s stock performs better during 2001? Why?
What is the bottom line to measure manager performance? Future or history?
3) How does the Home Depot forecasting model work? Why do we use ratios to forecast financial statements? Hint: walk through the mechanics of the model, focusing on the 2002 forecast (exhibit 8)?
Company Performance Analysis
Assignment of case 12
What is the current situation?
Why did the company run out of cash? Think of the source and use of cash.
What are the consequences for the company?
what is the effect of running out of cash to the company?
What are Kumar’s alternatives for action? And the effect and feasibility of each possible action:
1: Slower growth:
2: Improving profitability
3: Cutting dividends
4: reduce investment
What impact might the below two proposals have on the financial needs of the firm?
a): Proposal from the transportation manager to reduce raw material inventory.
b): Proposal from the operations manager to level production.
Below is a partial answer to the above homework questions by one of our writers. If you are interested in a custom non plagiarized top quality answer, click order now to place your order.
Company Performance Analysis Essay
Ratio analysis for Lowe’s
VALUE LINE PUBLISHING, OCTOBER 2002
Ratio Analysis for Lowes
Fiscal year
1997
1998
1999
2000
2001
Working capital (CA-NIBCL*)
772
1,012
1,460
1,539
2,063
Fixed assets
3,110
3,759
5,319
7,201
8,816
Total capital
3,881
4,771
6,779
8,739
10,879
Tax rate
38.9%
39.2%
39.0%
38.8%
38.6%
NOPAT (EBIT*(1-t))
381
507
715
858
1,104
PROFITABILITY
Return on capital (NOPAT/Total capital)
9.8%
10.6%
10.5%
9.8%
10.1%
Return on equity (Net earnings/S. Equity)
13.7%
15.4%
14.3%
14.7%
15.3%
MARGINS
Gross margin (Gross profit/Sales)
26.5%
26.9%
27.5%
28.2%
28.8%
Cash operating expenses/Sales
18.0%
17.9%
18.0%
18.5%
18.3%
Depreciation/Sales
2.4%
2.2%
2.1%
2.2%
2.4%
Depreciation/P&E
8.0%
7.5%
6.5%
5.8%
6.2%
Operating margin (EBIT/Sales)
6.2%
6.8%
7.4%
7.5%
8.1%
NOPAT margin (NOPAT/Sales)
3.8%
4.1%
4.5%
4.6%
5.0%
TURNOVER
Total capital turnover (Sales/Total capital)
2.6
2.6
2.3
2.1
2.0
P&E turnover (Sales/P&E)
3.4
3.4
3.1
2.7
2.6
Working capital turnover (Sales/WC)
13.1
12.1
10.9
12.2
10.7
Receivable turnover (Sales/AR)
85.6
85.1
107.5
116.6
133.5
Inventory turnover (COGS/M. inventory)
4.3
4.3
4.1
4.1
4.4
Sales per store ($ millions)
21.3
23.5
27.6
28.9
29.7
Sales per sq. foot ($)
254.3
256.2
279.1
277.1
274.0
Sales per transaction ($)
43.9
45.7
53.2
54.9
56.0
GROWTH
Total sales growth
20.8%
29.9%
18.1%
17.7%
Sales growth for existing stores
10.8%
17.3%
4.6%
2.9%
Growth in new stores
9.0%
10.8%
12.8%
14.5%
Growth in sq. footage per store
10.0%
7.6%
5.4%
4.0%
LEVERAGE
Total Capital/Equity
1.49
1.52
1.44
1.59
1.63
*Non-interest-bearing current liabilities
Company Performance Analysis
Which firm is the better performing one? On what basis do you conclude the better performance?
The analysis indicates that Home Depot is performing better than Lowe’s. The basis of this conclusion is a number of performance metrics and ratios from the analysis above. For example, in terms of profitability, Home Depot has a consistently higher return on capital and as well as a return on equity compared to Lowe’s. In terms of margins, Home Depot also had a consistently higher gross margin, operating margin, and NOPAT margin during the period.
In terms of the turnover, Home Depot has a higher turnover result from their capital allocation, P&E, working capital, and inventory. In addition, average of the sales per store, sales per square foot, and sales per transaction is higher for Home Depot than Lowe’s.
In terms of growth, the average is higher in each metric for Home Depot than that of Lowe’s. In each case, the average of the period is higher for Home Depot than Lowe’s. This implies that the growth in total sales, the growth of sales in the existing stores, the growth in new stores, is higher for Home Depot than it is for Lowes during the same period. As such, the various metrics and financial ratios in the analysis above point towards better performance for Home Depot compared to Lowes.
Who deserves the “Management of the Year” award in the retail building-supply industry based on 2001 firm performance?
The DuPont analysis conducted below indicates the return sources for both Home Depot and Lowe’s. The analysis also indicates various differences in the performance between the two companies.
DuPont analysis for Lowe’s
ROE
13.7%
15.4%
14.3%
14.7%
15.3%
NP Margin
4%
4%
4%
4%
5%
TATO
1.94
1.93
1.76
1.65
1.61
FLM
2.01
2.02
1.92
2.07
2.06
DuPont analysis for Home Depot
ROE
16.3%
18.5%
18.8%
17.2%
16.8%
NP Margin
4.8%
5.3%
6.0%
5.6%
5.7%
TATO
2.15
2.24
2.25
2.14
2.03
FLM
1.58
1.54
1.38
1.43
1.46
Beta is a financial ratio that measures the level of risk the company has in relation to the market (Bodie, Kane, & Marcus, 2013, pp. 171 – 172). The reason behind the firms’ similar level of risk exposure as indicated by the same measure of beta is due to the fact that both Lowe’s and Home Depot operate in the same segment of the same industry.
As such, they are exposed to the same market forces which direct the same level of market risk in the way of the retail stores in the building-supply industry. In addition, the WACC is different for the firms because they have different levels of leverage, with Lowe’s being higher as shown by the higher FLM ratio as indicated in the analysis above…..
Company Performance Analysis
Want help to write your Essay or Assignments? Click here
We can write this or a similar paper for you! Simply fill the order form!
Process Cost Accounting
ORDER INSTRUCTIONS
Overview
Complete a 3-part assessment in which you determine costs, solve problems using an average cost processing system, and compare and contrast how job order and process cost accounting systems differ for various items.
By successfully completing this assessment, you will demonstrate your proficiency in the following course competencies and assessment criteria:
Compute total cost of products transferred to finished goods.
Compute total cost of the work in a process inventory.
Compute unit cost for department and completed units.
Calculate equivalent units of production.
Competency 4: Apply cost analysis to assist management decision making.
Compare and contrast job order and process cost systems relative to labor, materials, and factory overhead.
Questions to Consider
To deepen your understanding, you are encouraged to consider the questions below and discuss them with a fellow learner, a work associate, an interested friend, or a member of the business community.
What would be the effect on the unit cost of finished goods if an estimate of the stage of completion of work in process was too high or too low?
Why is it usually reasonable to assume that labor and factory overhead are added evenly throughout the production process?
VanDerbeck, E. J. (2013). Principles of cost accounting (16th ed.). Mason, OH: South-Western Cengage Learning.
Chapters 5 and 6.
Wild, J. J., Shaw, K. W., & Chiappetta, B. (2011). Financial and managerial accounting: Information for decisions (4th ed.). New York, NY: McGraw-Hill.
We can write this or a similar paper for you! Simply fill the order form!
Process Cost Accounting
Assessment Instructions
Use the Assessment 2 Template to complete Part 1 and Part 2. Each part is a different tab in the template. For Part 3, create a Microsoft Word document. Submit both the completed template and the Word document for this assessment.
Part 1: Using Part 1 of the template, read the Central Manufacturing Company scenario and then complete the following:
Determine the unit cost for the month in finishing.
Determine the total cost of the products transferred to finished goods.
Determine the total cost of the ending work in process inventory.
Part 2: Using Part 2 of the template, solve the Central Manufacturing Company problems using an average cost processing system.
Part 3: In a 1–2-page Microsoft Word document, compare and contrast how job order and process cost accounting systems differ for each of the following items:
Materials.
Labor.
Factory overhead.
Be specific, providing examples as needed, and follow APA style for citations and references. Use 12-point font and double space your paper.
We can write this or a similar paper for you! Simply fill the order form!
Want help to write your Essay or Assignments? Click here
Auditors and Regulatory Oversight
Order Instructions:
The Securities and Exchange Commission (SEC) regulates public companies. The SEC has found that some of these companies have violated GAAP by using creative accounting practices to mislead investors and creditors regarding the health of their company.
Use the Internet or Strayer Library to research a recent accounting scandal within the last five (5) years where the SEC accused public companies of accounting irregularities.
Write a three to four (3-4) page paper in which you:
Analyze the audit report that the CPA firm issued. Ascertain the legal liability to third parties who relied on financial statements under both common and federal securities laws. Justify your response
Auditors and Regulatory Oversight
Want help to write your Essay or Assignments? Click here
Speculate on which statement of generally acceptable auditing standards (GAAS) that the company violated in performing the audit.
Compare the responsibility of both management and the auditor for financial reporting, and give your opinion as to which party should have the greater burden. Defend your position.
Analyze the sanctions available under SOX, and recommend the key action(s) that the PCAOB should take in order to hold management or the audit firm accountable for the accounting irregularities. Provide a rationale for your response.
Use at least two (2) quality academic resources in this assignment. Note: Wikipedia and other Websites do not qualify as academic resources.
Auditors and Regulatory Oversight
Want help to write your Essay or Assignments? Click here
Your assignment must follow these formatting requirements:
This course requires use of Strayer Writing Standards (SWS). The format is different than other Strayer University courses. Please take a moment to review the SWS documentation for details.
Include a cover page containing the title of the assignment, the student’s name, the professor’s name, the course title, and the date. The cover page and the reference page are not included in the required assignment page length.
Want help to write your Essay or Assignments? Click here
The specific course learning outcomes associated with this assignment are:
Analyze the required generally accepted auditing standards, professional ethics, and legal liability of the auditor.
Assess how the Sarbanes-Oxley Act has affected auditing.
Evaluate an audit report.
Evaluate objectives for conducting audits, and compare management’s and auditors’ responsibilities.
Use technology and information resources to research issues in auditing.
Write clearly and concisely about auditing using proper writing mechanics.
We can write this or a similar paper for you! Simply fill the order form!
Want help to write your Essay or Assignments? Click here
Cash flow and working-capital management
1: Case reading: Read through the Horniman Horticulture case (Case 11) in the text and answer the following questions. (50 points)
Case description:
Horniman Horticulture case captures the problems concerning cash flow and working-capital management typical of small, growing businesses. At the end of 2005, Bob and Maggie Brown have completed their third year of operating Horniman Horticulture, a $1-million-revenue woody-shrub nursery in central Virginia. While experiencing booming demand and improving margins, the Browns are puzzled by their plummeting cash balance. The case highlights the difference between cash flow and accounting profits, as well as the common negative effects of growth on cash flow. The case also provides a forum for:
i. instilling appreciation for the relevance of free cash flow to business owners and managers,
ii. introducing financial-ratio analysis,
iii. working-capital management, and
iv. motivating the use of financial models.
Want help to write your Essay or Assignments? Click here
1): a. From an Income Statement perspective what is going right with this business?
i. list why you believe things are going right in terms of ratio analysis?
b. What concerns you with the balance sheet?
i. support your concerns with ratio analysis?
2. a. What are the 4-yr cumulative cash flows?
b. Where is the cash going?
Want help to write your Essay or Assignments? Click here
3. a. What is Maggie’s accounts payable policy?
b. Do you agree with Maggie Brown’s accounts-payable policy?
4. a. What are the alternatives for solving the business’s cash problem?
The free-cash-flow calculation provides a reasonable framework for establishing the alternatives facing the Browns.
b. Explain how realize the Browns can solve their problem?
2: Based on the 2016 financial report of Facebook, forecast the financial performance in 2017, using percent of sales forecasting method. (50 points)
Since there are only two balance sheets, you just use the data available to do forecasting. Let me know your method of finding your base year, average, last year’s value, etc.
We can write this or a similar paper for you! Simply fill the order form!
Want help to write your Essay or Assignments? Click here
Project Value Comparison
Which of the two projects, 7 or 8, is more attractive?
Project 8 is more attractive compared to project 7. The reason for this being that project 8 has a higher sum of cash flow benefits over its life. In addition, the net present value of the project is higher than that of project 7.
How sensitive is our ranking to the use of high discount rates?
The ranking methods used are sensitive to high interest rates. At a discount rate of over 10%, there are significant changes in the ranking of the projects. A common observation is that the rank of any given project declines with the increase in the discount rates.
Why do NPV and IRR disagree?
The cause of the disagreement between the NPV and IRR ranking of the projects is due to the differences in the metrics of measurement. While the NPV measures the discounted present value of the entire project cash flows, IRR provides a measure of the average returns of the project over its life. Fundamentally, therefore, these measure different aspects of the project and would therefore disagree.
Project Value Comparison
Want help to write your Essay or Assignments? Click here
What rank should we assign to each project?
Using the NPV method and a 10% discount rate, project 3 ranks first, project 4 second, project 8 third, project 7 fourth, project 5 fifth, project 1 sixth, project 6 seventh, and project 2 eighth.
Why do payback and NPV not agree completely?
Payback is a measure of the time and number of periods that the project would take to recover the initial investment. On the other hand, NPV is a measure of the discounted present value of the project. This fundamental difference in measurements causes the two methods to differ. In addition, the project with the shortest payback may not provide value to the investor who is looking at increasing the value of their investment.
Why do average return on investment and NPV not agree completely?
Return on investment measures the value of returns to the investor, while NPV measures the value of the project at the current time. AS such, they measure different aspects of the project and are bound to differ.
Project Value Comparison
Want help to write your Essay or Assignments? Click here
Which criterion is best?
The net present value (NPV) is the best criterion as it measures the performance of the project itself. In addition, NPV uses discounting to portray the value of the project at the current time by considering the time value of money.
Are those projects comparable based on NPV?
The comparison of the projects are based on the current value of the projects. As such, NPV is a good measure for the projects.
Because the projects have different lives, are we really measuring the “net present” value of the short-lived projects?
Yes. The short term projects have the same basis of comparison since the values of future cash flows are discounted back to the present using the same discount factor without regard for the length of the project.
What is the equivalent-annuity method and when is it called for in project comparisons?
The equivalent annuity method is a measure of the average payout over the life of the project. The measure is important when comparing projects with a similar life.
Project Value Comparison
We can write this or a similar paper for you! Simply fill the order form!
Want help to write your Essay or Assignments? Click here
Sole Proprietor Income Deductions
Analyze official rules and instructions to complete a Schedule C and related required tax forms, to reflect income and deductions related to self-employment as a sole proprietor.
Note: Completing a tax form requires specific steps that need to be executed in a sequence. The assessments in this course are presented in sequence and must be completed in order. Incorrect entries in previous assessments will result in incorrect entries in future assessments. Do not complete Assessment 2 until you have submitted and received faculty feedback for
Assessment 1.
The use of Schedule C is required when the individual’s business is not incorporated or formed as a partnership or limited liability company. By successfully completing this assessment, you will demonstrate your proficiency in the following course competencies and assessment criteria:
• Competency 1: Analyze the background of the federal income tax system.o Analyze official information to identify tax forms required for a sole proprietorship
• Competency 2: Analyze the basics of individual income tax return preparation.o Analyze official rules and instructions to determine eligible business tax credits.o Analyze official rules and instructions to determine eligible deductions.o Analyze official rules and instructions to correctly compute SE tax and SE deduction.o Interpret official rules and instructions to record correct entries on all tax forms.
Sole Proprietor Income Deductions
Want help to write your Essay or Assignments? Click here
Context
“The government’s view of the economy could be summed up in a few short phrases: If it moves, tax it. If it keeps moving, regulate it. And if it stops moving, subsidize it.” — Ronald Reagan.
If an individual is searching for a tax strategy to offset his or her income from a primary job, being self-employed on the side is quite possibly one of the best options, along with being a real estate property owner or an investor. Each of these has the advantage of allowing an individual to reduce current income by any losses suffered from freelancing, renting out property, or investing.
However, the individual takes on additional work for the filing process. Schedule C must be completed, a task that requires an individual to know much more about the tax rules for recognizing income and maximizing expenses than many persons are willing to invest the time to research.
Question to Consider
To deepen your understanding, you are encouraged to consider the questions below and discuss them with a fellow learner, a work associate, an interested friend, or a member of the business community.
• What are the financial advantages of self-employment?• Can a person have multiple Schedule Cs?• What are the financial implications of hiring employees versus independent contractors?
Resources The following resources are required to complete the assessment.
Internet Resources
Access the following resources by clicking the links provided. Please note that URLs change frequently. Permissions for the following links have been either granted or deemed appropriate for educational use at the time of course publication. RS.gov is the homepage for the federal IRS Web site. Use the tabs at the top of the page to navigate the site. The Interactive Tax Assistant and Tax Trails are tools that walk you through a series of questions to find answers to tax questions.
FORM 1040: SCHEDULE C SELF-EMPLOYED BUSINESS INCOME Taxpayers who attribute a large portion of their taxable income to operating a self-employment business or trade must complete Schedule C to determine the presence of a business income or loss. The income from this endeavor is netted with related ordinary and necessary business expenses to calculate the increase or decrease in AGI that result from the self-employed trade or business.
In addition to completing and filing Schedule A with the taxpayers Form 1040, it may be necessary to file Schedule SE (Self-employment Tax), as well as Forms 8829 (Expenses for Business Use of Your Home) and 4562 (Depreciation and Amortization).
• J. K. Lasser Institute. (2015). Your income tax 2015: For preparing your 2014 tax return. Hoboken, NJ: Wiley.
• J. K. Lasser Institute. (2014). Your income tax 2014: For preparing your 2013 tax return. Hoboken, NJ: Wiley.
• Herman, T. (2014, February 16). Home-office deduction simplified. The Wall Street Journal, p. 2.
• Flynn, K. E., Belak, P., & Soltis, G. (2014). Understanding individual tax compliance: Advanced deductions and related issues. Journal of Business Case Studies, 10(4), 425–440
• Korb, P. J., & Williams, J. L. (2014). Simplified option versus regular method for home office deductions. The CPA Journal, 84(12), 36–39.
• Intuit Inc. (2015, January 26). Intuit’s QuickBooks Online Self-Employed integrates with Stripe, simplifying tax reporting for on-demand economy workers [Press release]. Business Wire.
• Everett, J. O., Hennig, C. J., Raabe, W. A., & Sonnier, B. M. (2013). Tax planning opportunities for individual net operating losses. Journal of Taxation, 119(3), 108–116.
Sole Proprietor Income Deductions
Want help to write your Essay or Assignments? Click here
o The IRS has a channel on YouTube devoted to income tax information in a video format. There are numerous videos available to help you with the course assessments. Videos are available with closed captions and in ASL and multilingual versions. You can search this channel by topic.
Assessment Instructions
Note: The assessments in this course are presented in sequence and must be completed in order. In Assessments 2–5, you will work step-by-step toward completing a 1040 tax return and all the necessary related forms, based on a provided scenario. Do not complete Assessment 2 until you have submitted and received faculty feedback for Assessment
1.Calculating correct entries for self-employment requires significant research. For those are who self-employed, entries from self-employment tax forms are necessary to complete the 1040 form.
For this assessment, use information and publications from IRS.gov and the other IRS resources linked in the Resources under the Required Resources heading to research the regulations and complete the appropriate self-employment schedules, based on the provided scenario.
Sole Proprietor Income Deductions
Want help to write your Essay or Assignments? Click here
Complete the following:
• Read the information provided in the scenario below.
• Download the appropriate forms and publications from IRS.gov to complete this assessment.
• Complete the entries on tax forms required for a sole proprietorship return.
• Analyze official rules and instructions to correctly compute SE tax and SE deduction.o 1040sc.o 1040sse.
• Determine whether Jacob’s business is eligible for any tax credits.o Is Jacob’s business eligible to use the Work Opportunity Credit and Disabled Access Credit?
• Determine eligible business deductions.
• Interpret official rules and instructions to record correct entries on all related self-employed schedules.
• Submit the tax forms.
Scenario Jacob Weaver is a contractor operating as a sole proprietorship (EIN 99-3456789). • 2016 net income: $133,000.
• Clients owe him a total of $53,000 for work completed in 2016.
• 2016 estimated tax payments: $25,000.
• Jacob and Taylor bought their first house in 2016.
• He is using a bedroom in his house as a home office. The room is 15′ x14′.
• He has one half-time employee, Martin, who had been unemployed since returning from Afghanistan and is disabled.o Martin worked for Jacob for 20 hours a week, for 41 weeks of 2016.o Martin earned $10,500.o Jacob had to spend $7,350 for disabled access equipment for Martin
Sole Proprietor Income Deductions
Want help to write your Essay or Assignments? Click here
Use the IRS.gov website and interactive tools, linked in Required Resources, to complete all related self-employed schedules, based on the scenario information below.
Complete the tax forms required for a sole proprietorship return.
Determine if Jacob’s business is eligible for any tax credits.
Determine eligible business deductions.
Analyze official rules and instructions to correctly compute SE tax and SE deduction.
Interpret official rules and instructions to record correct entries on tax forms.
Scenario:
Jacob Weaver is a contractor operating as a sole proprietorship (EIN 12-3456789).
2016 Gross income: $243,322.25.
Business expenses: Fuel for equipment $64,080.00
Repairs and maintenance $17,342.00
Lubricants for Equipment $9,670.00
Insurance $6,500.00
Wages $6,300.00
Vehicles $1,768.00
Legal and Professional Expenses $1,750.00
Taxes and Licenses $1,412.00
Advertising $300.00
Clients owe him a total of $53,000, for work completed in 2016.
2016 estimated tax payments were $18,000.
He is using a bedroom in his house as a home office. (Square footage of home 5,600 Office 240 sq. ft.)
He has one half-time employee, Martin, who had been unemployed since returning from Afghanistan, and is disabled.
Martin worked for Jacob for 20 hours a week, for 41 weeks of 2016.
He earned $10,500.
Jacob had to spend $7,350 for disabled access equipment for Martin.
Want help to write your Essay or Assignments? Click here
Want help to write your Essay or Assignments? Click here
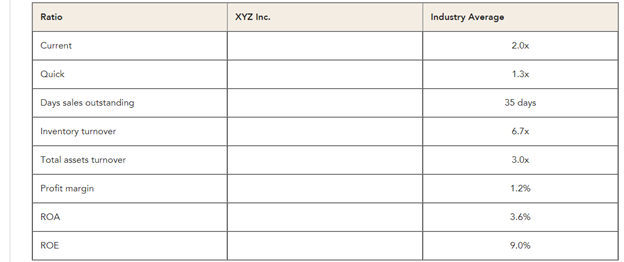
Financial Ratio Analysis
Using the XYZ Balance Sheet and Income Statement linked in the Resources and the table provided below, complete the following for XYZ Inc.:
Calculate the indicated ratios for XYZ.
Construct the DuPont equation for both XYZ and the industry.
Use your analysis to outline XYZ’s strengths and weaknesses.
Say XYZ had doubled its sales as well as its inventories and common equity during 2013. Do you think this would this affect the validity of your ratio analysis? No calculations are necessary.
Want help to write your Essay or Assignments? Click here