Want help to write your Essay or Assignments? Click here
Distance Influence on Foreign Direct Investment
Berry, Guillén and Zhou, 2010 Opines that FDI commonly has two general characteristics. It entails a 10 % ownership value as an ordinary matter. FDI also consists the opening transaction that liquidates investments and also the proceeding transactions done by the direct investor together with the investment company that focuses on maintenance, expansion, and reduction of the expenses. In the definition of FDI, there are three distinct features, flows of the new foreign equity, intra-enterprise debt transactions and the reinvested income.
Emerging countries are rapidly growing as primary and significant sources of foreign direct investment flow to the lead economy countries. Most enterprises from developing countries have become key, foreign investors in the international market. However, the bilateral FDI flow between countries has been affected by several factors. Part of this paper is an investigation on how various concepts of distance influence the flow of bilateral FDI between the global economies.
The different distance concepts are introduced and discussed in detail. Another concept, Liability of foreignness (LOF), is also introduced, and its impact on the trade balance highlighted as well. Lastly, the reader will find useful information on the benefits of the firm’s acquisition over a green field venture. The criteria of a business location selection are also illustrated in conclusion.
Want help to write your Essay or Assignments? Click here
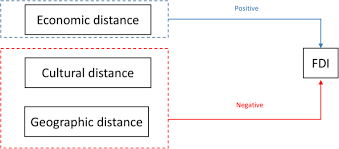
Distance has become a hindrance to economic activities across the borders in international trade and markets. There is a dire need for any multinational enterprises to consider all concepts of distance before commencing their transactions in any country. The significant distance features to look encompass of spatial and institutional features. Geographic distance has over time been related to the costs of transport incurred in remote locations business transactions as well as the LOF.
Non-geographic distance factors have also been linked to the explanations in the respective businesses across the borders. Such features include; social, cultural, economic and normative differences. According to studies in business management, the emphasis has been laid on cultural and psychic distances that are regarded the greatest determinants in the FDIs location.
International trade research recommends that the institutional and social features be considered in the business theory so as to cab the broad range of hindrances that have been linked to geographic distance. Longer geographic distances could result in the increment of transport costs, challenges while dealing with different regulations and institutions. It is likely going to be a difficulty in understanding markets with another level of economic development (Berry et al., 2010).
Want help to write your Essay or Assignments? Click here
The density of distance concepts and their effects on the FDIs may be best appreciated if viewed across the regions, functions and firms. The evaluation across the region signifies a separation point from the traditional methods of analyzing location decisions of FDI. Cultural differences refer to the disparities in norms and values between the host and the home country. It is very significant since the national values among employees and countries affect how individuals act and hence have an impact on the establishment of a firm.
To understand the cultural distance as a determinant of FDI flow, it is necessary to measure it by the aid of Schwartz’s orientation of gender and culture equality. Two known orientations are embeddedness and autonomy. Embeddedness characterizes people more collectively thus social relationships with groups of people are highly regarded as individuals work towards common goals. In autonomy, people value the uniqueness of each person, and one is entitled to their feelings and ideas.
Another important aspect is the gender equality, which is not only a social factor but has an impact on the economic development of any country. Women form a significant part of the workforce in several sectors of growth. There tends to be a positive relationship between the level of human capital, other economic conditions and the women rights (Siegel, Licht and Schwartz, 2012)
Want help to write your Essay or Assignments? Click here
The liability of foreignness as the total of costs comprises of the unseen costs associated with the engagement with new legislatures and cultures when doing business abroad unlike home. Elango (2009) asserts in his definition of LOF that it results in a disadvantageous competition for any multinational company. Generally, according to Elango, the costs incurred by an enterprise abroad would not be incurred by a similar local company. The genesis of such costs could be cultural, geographical, economic and institutional distances that lead to an increment in costs and makes it hard to succeed abroad.
LOF majors on the social expenditures of transactions overseas. Such costs are gotten from the relational, unfamiliarity and discrimination challenges faced by the foreign companies, unlike their domestic counterparts. They are innately uncertain and may be incurred even in future. Unfamiliarity costs are a reflection of poor experience or knowledge in the foreign country hence a setback to the foreign companies as likened to the local enterprises. There is a tendency for the foreign investors to pay handsomely for what the locals acquire cheaply or at zero cost.
For instance, local banks in Germany are likely to have a sigh of relief if the Bundesbank lowers the interest rates in a day’s time but British-based banks in the country may have nothing to celebrate. Such an LOF is related to the durability of its existence in the host nation. Short-term resolutions in the foreign country result to unexpected challenges that are covered in the additional costs incurred by the multinational company to realize a similar level of host-market awareness as the domestic company.
Unfamiliarity hazards result in a rise in the average cost of the foreign company, but the production level remains constant. Such as building market awareness costs should be gotten rid of with time, although they may persist if the multinational corporation managers continue adhering to the global strategy and fail to involve themselves in the civic learning (Barnard, 2010).
Want help to write your Essay or Assignments? Click here
A green field venture means starting off an enterprise from scratch, which is from a green field (Klimek, 2011). Acquiring an existing company as opposed to Greenfield venture has several merits. Firstly, it is faster. If the investor wanted the company to take a shorter time for their presence to be noted as well as compete well at entry level in the market, then this would be the best option. Greenfield ventures demand a longer period of physical construction and developing the company. The acquisition is one of the cost-effective means for the investment to realize a competitive mileage in technology, brand name, distribution and logistical advantages as it gets rid of the local competitor.
International political, economic and foreign exchange state may cause imperfections in the market thus causing the target companies to be underestimated. Several MNEs in Asia have been targeted in the recent past due to the economic crisis in the region that consequently impacts on their financial wellbeing. This has left many companies in a state of desperation for capital injections to survive competitively. The acquisition is the best strategy to solve such challenges as maneuvering through the local distribution channels, recruitment of the local employees, and it also creates a platform with a readily established market with a customer base.
Such factors shorten the time needed for the venture to break even. On the other hand, cross-border acquisitions have their shortcomings that the investor needs to consider before making the bold step. The costs of acquisition and financing are relatively too high. It can be difficult to mesh diverse corporate cultures. It may force the management to consider slimming down in order to up the economies of scale. The outcomes of such a step may not be productive to the firm since there is a tendency for individuals to try saving their jobs.
Other difficulties may emanate from the host nation’s interference with financing, pricing, market segmentation; employment guarantees favoritism and overall nationalism. An investor may decide on acquiring a joint venture. In such a form the investor accesses the local partner’s experience and skills, the government contacts and the knowledge about the local market. A joint venture is thus regarded the best way of investment (Becker & Fuest, 2011).
Want help to write your Essay or Assignments? Click here
The business location is critical for any venture to realize growth as well as experience successful operations. Choosing a business location requires precision in market research and planning. It is imperative to put into consideration several factors when making a choice for the company’s location. Several aspects are involved such as assessment of the supply chain, observation of the demographics, understanding state legislature, staying on budget and scoping the competition.
Some other factors to focus on in the research include; the company needs, employees, customers, the equipment required to deliver services among others. Talking of the company needs, most enterprises make a location choice that gives them accessibility to their customers. On this note, it is vital to consider the brand image and ask whether the location is going to be consistent with the intended brand. Establish whether the companies around are complementing or competing for the venture.
It is very necessary mostly where shopping comparisons are common. If the competitor is likely to make the environment tougher then it is advisable to shift the location. There is a need to find out whether the target area has potential employees and the rates of labor. If the business has a prospect of growth, then one should look for a building that offers room for expansion.
The business should also be located at a place where suppliers can quickly find you. One has to think also of safety too, thus, questions about the crime rate in the select area need be asked. Zoning regulations; these help determine whether one may conduct their type of venture in a given building or location. This may be found out through holding the local planning agencies (Cavusgil et al., 2014).
Want help to write your Essay or Assignments? Click here
The business location should be consistent with one’s style of operation. There is a need to determine whether the intended operation is going to be formal or informal. In cases where the customer base is local one is required to find out whether the population matches the customer profile for the business support. Find out whether the community has a stable economy for the company’s well-being.
It is vital to be cautious with a community that solely dependent on a particular company for their economy since this could lead to a downturn that is not healthy for any business. Having the knowledge about the legislature on businesses in a given location is very essential. Look into hidden costs because not many spaces are business ready thus requiring a lot of initial work be done before start-up. Determine also whether the select location qualifies you to access the government economic incentives (Hair Jr et al., 2015).
Want help to write your Essay or Assignments? Click here
Becker, J. and Fuest, C., 2011. Tax competition—Greenfield investment versus mergers and acquisitions. Regional Science and Urban Economics, 41(5), pp.476-486.
Cavusgil, S.T., Knight, G., Riesenberger, J.R., Rammal, H.G. and Rose, E.L., 2014. International business. Pearson Australia.
Elango, B., 2009. Minimizing effects of ‘liability of foreignness’: Response strategies of foreign firms in the United States. Journal of World Business, 44(1), pp.51-62.
Hair Jr, J.F., Wolfinbarger, M., Money, A.H., Samouel, P. and Page, M.J., 2015. Essentials of business research methods. Routledge.
Klimek, A., 2011. Greenfield foreign direct investment versus cross-border mergers and acquisitions: the evidence of multinational firms from emerging countries. Eastern European Economics, 49(6), pp.60-73.
Siegel, J.I., Licht, A.N. and Schwartz, S.H., 2012. Egalitarianism, cultural distance, and FDI: A new approach. Organization Science, Forthcoming.
Want help to write your Essay or Assignments? Click here
Want help to write your Essay or Assignments? Click here
Business Operations Decision
This paper aims at presenting low-calorie microwavable foods to support the firm’s continuous operational decisions. The paper will assess the results of supply chain since it demonstrates the existing market structure while putting into consideration the expected changes to sell environment and some of the factors that may lead to such a change. Also, the paper will assess the main short run as well as long-term production and cost functionalities as used to new cost information to establish whether there are conditions that can result in discontinuation of business operations decision.
Because there are changes in the market structure, it is important to examine the pricing structure to increase profits. In the end, the paper will present two strategies the firm should implement to enhance profitability while maximizing shareholder value.
Market Structure and Its Effectiveness for the Company
Each firm in a competitive market is the plays an important role in determining the price while the equilibrium cost as well as productivity in the industry are due to supply and demand. Low-calorie microwavable food market demonstrates the way in which demand and supply produced in perfect competition; regulate total productivity and the cost clients are ready to part with. In this case, the equilibrium cost and quantity are 407.65 and 24,335 respectively.
QD = 65,100 -100P
Qs = -7909.89 +79.0989P.
Companies in the purely competitive market have no power regarding the cost of their goods. Nevertheless, it may determine the quantity supplied to the market. Success or failure relies mainly on a pure competitive selling environment and the manner in which the firm identifies production expenses and depicts its products. The capacity of productivity revolves around the revenue the company will generate by producing goods (McGuigan, Moyer & Harris, 2014).
The company should implement strategies of conducting operations to make sure that it increases profits and output in the long run. An effective strategy is necessary when it comes to defining the efficacy of selling environment the firm operates. Furthermore, a proper plan will mainly highlight the availability of products, some enterprises participating, pricing patterns and powerful methods of brand promotion.
Business Operations Decision
Want help to write your Essay or Assignments? Click here
2. Changes in market structure and reasons that have caused changes from the market structure specified in Assignment 1.
Market survey shows that variations in the market structure are based on perfect and the imperfect market systems (Bragg, 2012). In an imperfect competitive oligopoly environment, the organization has the power to determine the price of its products. Information on competing organization demonstrated that there about 15 firms competing for low-calorie microwavable foods’ market share, out of which three companies control 75% of the market.
When it comes to sells, the firm is position 2 with approximately 77% of low-calorie microwavable foods, which reflects market concentration share, which is simply a measure of total market main players in the sector possess. For that reason, it may be necessary to assume that the firm is currently operating in the oligopolistic market, which is a competitive selling environment with relatively a few firms offering comparable brands as well as services (Routledge, 2008). The primary cause of such market is the withdrawal of rivals or increases or declines in the product costs (Bragg, 2012).
These changes mostly impact the operations of the company in different ways. To start with, there is likely to be significant output because the market share grows due to increases operation expenses influencing advertisement and labor costs. It is clear that labor costs may decline in the long run since the companies are controlling new firms are solidifying while redundant positions are eliminated (McGuigan, Moyer & Harris, 2014). Moreover, these changes can make an organization to modify its operations and adopt modern technologies in the operations.
Business Operations Decision
Want help to write your Essay or Assignments? Click here
3. Short and long-run production and cost functions for the frozen, low-calorie microwavable food company.
TC = 160,000,000 + 100Q + 0.0063212Q2
VC = 100Q + 0.0063212Q2
MC= 100 + 0.0126424Q
From assignment 1 QD = 350,000 -100 P
QS = -7909.89 + 79.0989P
ATC = TC/Q
= (160,000,000/Q) + (100Q + 0.0063212Q2)/Q
= (160,000,000/Q) + 100 + 0.0063212Q
AFC = 160, 000, 000/Q
AVC = 100 + 0.0063212Q
To determine production level for minimizing average total price, it is necessary to compute the average total cost to minimum cost.
This to say; the cost of Q =159,096.35 exemplifies production level, which reduces the average total cost. Meanwhile, when production level = 159.096.36, it is easier to fabricate optimum average collective price.
To determine the time it takes manufacturing at the lowest average total cost (ATC):-
This presents per-unit price of production, especially the proficient echelon. In the long-run, if the market varies, a company is forced to generate at the lowest total average price.
Business Operations Decision
4. Circumstances under which a firm should cease operations.
The association between ATC, average variable cost (AVC), and minimal costs (MC) can be illustrated well using a graph. The MC curvature transects the ATC and AVC curves at their lowermost points. Subsequently, price plummets with MC beneath AVC; however, price rises when the MC is above the average cost. While MC represents price of fabricating the last production unit, MC curve escalates with the measure of production, as such, the MC curve intersects ATC and AVC curves underneath their lowest points and increases.
The form of Minimal Cost curve is informed by the Rule of Shrinking Earnings. Shrinking proceeds in the fundamental logic come about in the event that marginal product flows an increasing measure of a parameter with a corresponding input is smeared to a fixed one (McGuigan, Moyer & Harris, 2014).
In this regard, the closure point is where the minimum AVC overlaps the MC. The firm can contemplate shutting down operations, when the cost plummets below the lowest point b as indicated on the graph. Implicitly by closing down the business can avoid running into more losses. It is only prudent for the organization to close down operations instead of accruing losses.
Business Operations Decision
However, the company can only go about with services by putting in place contingency measures and a strategy that allows it to change tactic and curtail losses (McGuigan, Moyer & Harris, 2014). This may be realized by changing production to a different SRATC curve through several capital alternatives.
When it comes to the breakeven point, the MC transects the ATC. Nonetheless, if the market price falls beneath $21.11, represented by point C on the chart, and above point b, the business may proceed with activities in the short-term. Largely, this may be because the price at the lowest point takes care of variable and fixed cost. Nonetheless, in the long-term under competitive setting, the firm has to quit the industry. As recapped by Stokes, the company’s administration has to play an integral role when it comes to market issues, putting market research individuals and being at the forefront dealing with market costs (Stokes, 2008).
Business Operations Decision
Want help to write your Essay or Assignments? Click here
5. The pricing policy that will allow frozen, low-calorie microwavable food company to capitalize on profits.
With regards to increasing profitability, I suggest cost profit maximization method, whereby the marginal revenue is equal to marginal cost. In this procedure, the firms examine the suitable output with the price levels with the goal of increasing returns. Quantity q* is illustrated by the convergence of MR and MC curves. The price that matches the amount is obtained by increasing q* with the demand curve to find p*.
There is another useful price rule that will be effective at a high rate will reduce the sales below q* while a lower price is likely to increase sales above q*. With the demand function, QD=350,000- 100P, inverse demand function can easily be calculated;-100P =350,000-Q.
P= (350,000/100) – Q/100
= 3,500 – 0.01Q
Total Revenue (TR) = P*Q
= (3,500 – 0.01Q)*Q
= 3,500Q – 0.01 Q2
MR = TR/Q
= 3500-0.02Q
Therefore, to increase earnings, marginal revenue should be compared to marginal cost.
MR = MC
3,500 – 0.02 Q = 100 + 0.0126424 Q
3,400 = 0.0326424Q
104,159.01 = Q
Q denotes return optimizing production that is beneath the output at the lowest average total yield. Therefore, realizing the actual cost for the fabricated unit, to enhance profit, the quantity in the profit is substituted as follows:-
P = 3,500 – 0.01Q
= 3,500 – 0.01Q (104,159.01)
= 2,458.41 = $ 24.58
Want help to write your Essay or Assignments? Click here
Business Operations Decision
6. To evaluate its financial performance.
Based on this computation, production permutation of 104, 159.01 units and with $24.58 as the retailing price puts us at the apex of our profit activity. Owing to our market power, the amalgamation puts the company in the changeable position of the demand curve. Any increase in the price will culminate in the loss of market share and a price fall that lead to higher profit realization. The computation below evaluates the fiscal performance with a fabrication quantity of 104,159.01 units
Products retailing at $24.58 and nevertheless, it take $22.95 to manufacture, generating earnings to the tune of $1.63 per unit. This is a monetary profit.
In this case, short-range earnings would be computed as; T R – TC
Where; TR = P *Q
Therefore; $24.58 * 104,159.01
= $2,560,228.47
TC = ATC * Q
$22.95 * 104,159.01
$2,390,449.28
Profit = $2,560,228.47 – $2,390,449.28
$169,779.19
Want help to write your Essay or Assignments? Click here
Business Operations Decision
7. Two (2) ways the firm can improve profitability and deliver more value to its stakeholders.
The significant costs to the firm are increasing energy costs, and raw material. Much as the organization has broadened the operations through brand innovations; the fixed as well as variable costs keep on increasing. The organization should search for strategies of reducing fuel, raw material and packaging expenses (Bragg, 2012). With regards to reducing fuel costs, the firm can use a direct delivery structure regarding scheduled sales and online orders by each client. Consequently, the company may put into consideration other external delivery channels.
Because the firm handles individual client orders, it should it account the use of direct to customer sales as a campaign to fund learning institutions or other entities. Again, the company needs to consider the techniques of minimizing packaging expenses by either converting the material to cryogenic freezing or suitable packaging methods (Routledge, 2008). By and large, the organization should allow employee participation, especially in the identification of reducible expenses and strategies of conducting such identifications.
Want help to write your Essay or Assignments? Click here
The Sarbanes-Oxley act
The Sarbanes-Oxley act was given a node by the congress. The decision to bring this law into action was to protect the individuals who had interest in various firms from being duped. The congress was afraid of situations where shareholders and other citizens lost act was The Sarbanes-Oxley act was developed to help in reducing the mis-use of investors by fraudulent firms. This act was put into action to ensure that all those who invest do not fall prey of those fraudulent persons. It became evident to the authorities that many investors were being harassed by the several fraudsters who had entered the sector.
The governance principles of regulatory compliance requirements related to Sarbanes-Oxley Act
The Sarbanes-Oxley Act is based on several regulatory compliance requirements. The compliance requirements have been put in place to ensure that the act is well understood by ll the users. The users are presented with such guidelines to ensure that they do not stray from what the act advocates for. One of the regulatory compliance requirements gives guidelines on disclosure controls. The section that hands the control of disclosures is 302.
This section advocates that all liable officers should ensure that they state their role on coming up and maintaining internal control in a firm. Secondly, this section guides on how all responsible officers should indicate that the firm’s information has been passed to the relevant stakeholders. This section also provides that all responsible officers should carry out analysis a of firm’s internal controls before making their reports.
Want help to write your Essay or Assignments? Click here
The other governance principle of regulatory compliance requirements related to Sarbanes-Oxley is improper influence on conduct of audits. This guideline is under section 303 of the Sarbanes Act. This section of the Sarbanes-Oxley act was aimed at ensuring that the accountants and auditors did their job in the recommended manner. This means that the auditors were supposed to start shedding the bad professional habits that used to make shareholders lose their investments in companies.
According to the Sarbanes-Oxley act, the accountants were supposed to ensure that the reports produced were as the true and fair view in a company. This means that the accountants were supposed to report business operations as they truly were. Regarding auditors, the Sarbanes-Oxley act stated that the auditors were supposed to ensure that their opinions are not compromised.
Section 404 of the Sarbanes act is the other regulatory guideline. This section states that the management should be able to produce a report that explains the level of internal controls in an organisation. This section is usually titled as the Sarbanes-Oxley act, section 404; the assessment of internal controls. Just like the requirement in section 302 for all signing officers to state their role in internal controls, section 404 stipulates that the management should state its responsibility when it comes to the internal controls of an organisation.
Under this section of the act, the management should be able to give a report that shows their assessment of the internal controls for all fiscal years.
Want help to write your Essay or Assignments? Click here
The role of the SEC and how Sarbanes-Oxley affected the agency
SEC refers to Securities and Exchange Commission. According to Kohn, Kohn and Colapinto, (2014), this is an agency in the United States f America which deals with companies whose shares are to be taken over by new owners. This commission ensures that there exists a smooth transition whenever there are takeovers of organisations. The smooth transition is usually aimed at ensuring that nobody ends up becoming aggrieved in the process of takeover. Basically, the introduction of the Sarbanes-Oxley Act was an added advantage to the SEC. This is because it brought about legislation that strengthened the policies SEC.
The Sarbanes-Oxley Act strengthened the enforcement of securities fraud and helped in the implementation of accounting reform. This was as a result of the Sarbanes-Oxley Act stating it clearly how all the officers in an organisation should be held liable regarding their actions. The guidelines brought about by the Sarbanes-Oxley Act have made all the professionals in audit and accountancy upholds high levels of integrity towards their work (Greg, 2015). The act has also made the management of organisations be in the forefront in ensuring that all the stakeholders are taken care of; most of all the shareholders.
Conclusion
Investors should always be protected by the authorities. This is why the congress came up with the Sarbanes-Oxley Act which was aimed at offering such protection. All the professional bodies should be able to monitor its members. This monitoring will be able to identify the rogue members and remove them from their recognition. This will be a move that will take all professionals towards discipline that protects corporate and the shareholders. It is advisable for the authorities to keep on improving the guidelines and principles that this act is based on.
This will be able to tighten any loose ends that might start developing as the targeted individuals discover new tricks. The review of the guidelines and principles will enable the act capture contemporary issues related to business operations and securities in general. According to Thompson (2014), shareholder protection strategies should always be incorporated in all legislation during reviews.
References
Greg, F. (2015). “America Robbed Blind.” Wizard Academy Press.
Kohn, S., Kohn, M. & Colapinto, D. (2014). Whistleblower Law: A Guide to Legal Protections for Corporate Employees. Praeger Publishers.
Want help to write your Essay or Assignments? Click here
Long-term Investment Decision
From the previous assignments, it was determined that the demand for low-calorie microwavable food is inelastic. The market for the product is also competitive meaning that the price of the commodity fluctuates from time to time. Therefore, the price of the low-calorie microwavable food can be made less responsive to market fluctuations or less price elastic in two ways. First of all is by making the product become more of a mass product that niche.
Secondly is to make its market rigid so that the clients for the product will have no alternative. This is because the customers will find no substitutes for the commodity and thus stick to it regardless of fluctuations (Brigham & Ehrhardt, 2013). The low-calorie microwavable food is healthy and convenient. To emphasize on these two main aspects, it is imperative to market and advertise the product with no close substitute by the two key attributes.
Government policies have both positive and negative impact on production and employment in the market. Governments always put in place rules and regulations that guide the way business is done in the market (Mason & Brown, 2013). These policies have an influence on profitability and competitiveness of business enterprises. Government policies act as market catalysts by changing the social behavior in the business environment.
By exempting some companies or particular sector in the economy from tax and duty, the government will be able to trigger investment and generate growth. On the same note, government policy helps to create political stability and hence promote local businesses as well as attract foreign investors.
Long-term Investment Decision
Want help to write your Essay or Assignments? Click here
Government spending also has an effect on businesses, increased spending result in increased taxes that might discourage investment. Similarly, the government can influence the interest rates. An augment in interest rates add to the cost of borrowing. Therefore, it will discourage business because the entrepreneurs and business enterprises will not be in a position to obtain enough capital at a low price (Tricker, 2015). Low-interest rates, on the other hand, encourage investment.
Trade regulations also have an impact on business activities. Regulations such as the requirement for permits, federal minimum wage among others affect business practices. However, fair and effective regulation tends to promote business growth.
In our case, the government policies help to ensure that there is fairness in the microwavable food industry. Government involvement in the low-calorie, frozen microwavable food industry has led to fairness in the following ways.
Fair Competition: Government involvement in the industry has let to fair competition among the key players in the industries. Some firms often use unfair competitive strategies that may be of harm to other key players in the industry. For instance, use in predatory pricing strategies where firms set low prices to attract more customers and drive out other competitors who do not enjoy the economies of scale.
Large companies with high economies of scale can maintain low prices while small and medium-sized firms may not be in a position to maintain such low prices without incurring losses. Therefore, such small companies may end up quitting the market making the remaining large corporations enjoy monopoly power. As such, these strategies are unfair to small companies and thus the government comes in to regulate prices and protect small infant firms.
Long-term Investment Decision
Want help to write your Essay or Assignments? Click here
Minimization of corruption through regulations: Government regulations often prohibit firms from taking advantage of their positions to ask for special treatment that can lead to their success in certain commerce or market economy. For example, some firms may bribe auditors to avoid scrutiny. Such practices are often illegal and unethical and result in unequal distribution of resources.
Undue advantage by some firms in the industry: Firms that are large and powerful often manipulate individual to gain favors at the expense of other firms. It is the requirement of the government to come up with regulations and rules that will ensure that there is an equal distribution of resources in the industry. The government should intervene and prosecute firms that take advantage of their position to make companies avoid such behavior. Therefore, it will enable companies in the low-calorie, frozen microwavable food to embrace legal and fair strategies that may not end up being unfair.
Therefore, government regulations have enabled the low-calorie, frozen microwavable food firm to enjoy fairness. Government regulations have enabled the company to have an equal opportunity of achieving tremendous success as long as it is in a position to develop legal and effective business strategies.
Similarly, government involvement in the industry helps to shield consumers from exploitation. It is the responsibility of the customer to ensure that products and services available to consumers are safe for consumption. In the same way, government develops rules that help ensure market efficiency and govern international trade.
Long-term Investment Decision
Want help to write your Essay or Assignments? Click here
Some of the major complexities that would arise under expansion via capital projects include:
Uncertainty: The process of capital budgeting is primarily based on future cash flow estimates. However, in the real situation, there are some uncertainties that can make a project fail. Capital budgeting analysis also utilizes multi-period model which lay down costs and benefits of more than one year. During this period, the cost or benefits factor may drastically change. Therefore, use of estimates and uncertainty, realities may result in complexities in capital budgeting (Kardes et al., 2013).
Discount factor: The process of capital budgeting is time-weighted. The future cash flow is often discounted using the present time discount rate. It is also difficult to choose a discount rate. Each project assumes a unique risk associated with itself making it difficult to approximate a discount rate for a project
Indivisibility: It is hard to divide a project. Therefore, a project must be taken up either in entirely or not at all.
Evaluation is also a big challenge: There are different techniques that are used such as discounted techniques and non-discounted technique, when evaluation techniques conflict, business acumen, and manager’s prudence takes over the capital budgeting decision (Healy & Palepu, 2012).
In the case of low-calorie, frozen microwavable food company the big issue is the agency problem. This problem is because of the conflict of interest between the managers and the stockholders. Therefore, the microwavable food company can take the following steps to help bring convergence between the firm’s managers and stockholders.
First of all, the firm should align some part of the compensation package to the sales and profitability growth of the firm. Similarly, the firm should plan for stock options with the requisite T & C and provide it to the management to make them feel that they are part of the company (Grant, 2015). This way, the managers will be able to think for the betterment of the firm. Finally, the firm should develop a profit sharing plan that is linked to the performance of the managers.
Long-term Investment Decision
Want help to write your Essay or Assignments? Click here
By employing the above strategies, the firm will be able to motivate managers to work towards achieving the organization goals (Tricker, 2015). This is because the managers will begin perceiving their owned align with organization goals. Due to their hard work the firm will achieve growth in profitability, sales and profitability of the company. Increased sales will result in an increase in the compensation of managers. On the same note, it will increase the share price of the low-calorie, frozen microwavable food company. Therefore, both the managers and stockholders will mutually benefit.
The name of the firm should not be used as an initiative of converging manager’s interest with those of the stockholders. The reason is that such strategy may result in copyright related issues. Be as it may, an organization with good HR practices can align the interest of managers, employees, and the stockholders. Performance management linked and motivation strategies such as bonus payment will also helps to converge the manager’s interest with those of the stockholders.
In conclusion, the low-calorie microwavable food can make its commodity less price elastic by making the product more of a mass product and making its market rigid. The government, on the other hand, helps in the regulation of the industry to ensure fairness in the low-calorie, frozen microwavable food industry (Mason & Brown, 2013).
When it comes to capital expansion, firms face complexities because of uncertainty, discount factor, abandonment options, indivisibility and conflict between evaluation techniques. Finally, the low-calorie, the microwavable food company can converge the company managers and stockholders interest by making the managers feel like they are part of the company and linking compensation schemes with the performance of the managers.
Kardes, I., Ozturk, A., Cavusgil, S. T., & Cavusgil, E. (2013). Managing global megaprojects: Complexity and risk management. International Business Review, 22(6), 905-917.
Healy, P., & Palepu, K. (2012). Business Analysis Valuation: Using Financial Statements. Cengage Learning.
Want help to write your Essay or Assignments? Click here
Venture Capital and Private Equity
Background
One major question that clicks into the mind is how the private equity and venture capital is different. Mere because both are used to refer firms that sell their investment in equity financing after they have invested in an organization. For the matter of facts, there exists a significant difference between these two; first, it is the way the firm performs their duties when involved in the two types of investment.
Secondly, the funds are used to purchase a different sizes and types of companies, and thus, claim a different percentage of equity in their invested companies, Cumming, (2013). In a technical way, Metrick, (2011), defines the term private equity as the money or cash invested in a company that becomes a private company through the investment. At the same time, these scholars state that sometimes, this term is used to refer companies that other firms through leveraged buyouts (LBOs). On the other hand, VC is an investment in business in the concept, start-up or during the early years of their establishment.
The paper will look into the Skylock Enterprise, which is a company that deals with clothing products. Frankly, speaking this is a fascinating company to be part of since established two years ago. Each and every day there a new opportunity present itself to build the great legacy we dream of. This company has grown into an integrated manufacturer of the highest quality clothes. This company operates one big plant located in the United States, seven outlets that provide retail services to our business.
In total, there are 543 employees for this company and walk home with over $100 million annual revenue, plus other health benefits (notably, the paper will work with US dollar unless otherwise stated). This company has a stellar reputation since its establishment in those two operational years. Its strongest suites being cotton clothes, women’s wear, men’s wear, as well as the children’s clothes.
Despite its good starting, this company is faced with a lot of challenges in the future. Skylock, manager Stanley White sees impending danger as there is a great competition from the large multi-national companies like Nike, Ralph Lauren among others. Great scholars like Ahlers, (2013), competition in most cases theoretically results in lowering the prices of the commodities, hence if this happens it can narrow the marginal revenue of the company.
Thus, this may limit the development and expansion of this great visional company. This makes the manager question whether this company will remain as innovative as it is, or does it need to adopt some changes. Thus, the major question remains, where Skylock Enterprise will focus its effort.
Due to the market condition in the United States, our company is a price taker, and we need to work on the set market price. In particular, we operate in a free market where no firm or entity has the ability to influence the prices in the market, Dix‐Carneiro, (2013). To succeed, we have to work with the price constraint and at the same time deliver the best quality goods. In fact, quality products always win the customer’s heart. This is in accordance with the factors that affect the demand for a commodity one being the quality (which affect the taste), the price among others Mankiw, (2014).
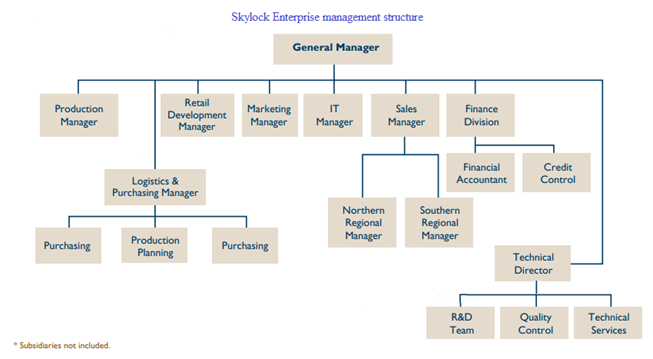
The Skylock company has excellent structure and one general manager who overlooks all the activities of the enterprise. Figure 1 is a management structure which portrays the general overview of the management team.
The primary focus of the firm in two years has been in the sales department since it plays an import role in advertising the company’s product. The core aim of this department is to increase the sale by two digit percent. Critical to note, in the two years of operation, the company revenue has risen by 5% and 8.6% consecutively. Thus, we are aiming at increasing this percentage to about 13%, this seems impossible, but through the proper financing of our sales, for appealing the commercial market is more oriented to the direct marketing than mass advertisement Danaher, (2011).
The statistics indicate that the firm used almost the same amount in direct marketing and advertisement. Hence, it will be ideal to adopt the direct marketing. Furthermore, the database used to target our marketing indicates that there has been an increase from 500 to 2500. This database includes suppliers and persons targeted specifically.
Skylock Enterprise also is also planning to produce newsletters and brochures that feature new designs and clothes in the market. This will be supplied free to opened outlets and any other targeted market, newsletters will also if there is, recent studies carried out by the firm. This will ensure that the customers are in the know what is going on with the company. Involving the company to the progress of an organization creates trustworthy and thus the customers feel more welcomed Mankiw, (2014).
Nevertheless, as compared to the main competitors to our company, we advertise less often. Taking into consideration that most of these firms have been in business for a long time. Thus, we need to advertise more often so that people can know about our existence. The aim is to raise the expenditure by 20% and target some of the new television series, which will quite improve company’s sales. The advertisement will majorly focus on all the brands in our store.
One of the greatest challenges that faces Skylock Enterprise is that it does not have many retail outlets as compared to its competitors. The location of the seven stores is in the main cities in the US. It is vital to operating our own retail shops since most of the larger firms (our competitors) control retailers. This has limited our sales as we solely depend on that seven retail for the entire revenue generation. The risk that the company faces the reputation risk, if it were to be damaged, the customers will become wary of doing business with us.
This will have not only an effect on the losing the customers, but also the revenue, and worst the sponsors and advertisers may turn their back on us. That is the reason we have a technical director that work with research and design team (R&D team) and the quality control department to ensure that all is well. The R&D department, more importantly, needs to be trained well, so as to keep the company with the trending fashions and also the market structure.
A second risk that this company may face is the financial risk. In particular, the cash that is flowing in and out of the organization, and the possibility of sudden financial loss. Our firm extends credit to some of the largest clients, hence, if they fail to pay on time or fails totally, then we are prone to incur a significant financial risk. To reduce the risk, the firm intends to operate at minimum credit services, and if it happens, it will be extended only to the few trustworthy customers, and it will only be a short-term credit. This is as suggested by the great economics scholars like Horcher, (2011).
Value Enhancement
As stated earlier, there are some of the strategies that the company is planning to undertake so as to improve the business performance, especially increasing sales volume. The firm first has prioritized the strategies and noted the objectives of each plan. First is the direct marketing strategy, which aims at increasing the sales, exploring the market and at the same time take the commodities to customers at their convenience places. Danaher, (2011) stipulates that direct marketing is convenient and also increases sales, especially when the products are unique and of high quality.
In fact, this is as a result of the impromptu purchase of the customers. The key measure that will be used to evaluate the success of this strategy is the use of consumption metrics. This is one of the many methods used to measure the content market success Parmenter, (2015). Importantly, they help in understanding the consumption behavior of customers to a particular piece of content. Thus, this will help Skylock to understand which design has high demand. The set strategy primary mandate is to increase sales by 10 percent.
The second strategy that Skylock will take to improve returns is increasing the number of retail outlets in different parts of US cities. This will be a way of ensuring that we expand the channels through which we reach our esteem customers. Furthermore, it is a method of increasing our market (through geographical coverage). This will increase the sales by about 50-77 percent.
The key performance indicator that will be employed to evaluate the success of this strategy is through data collection and analysis. As stipulated, the core purpose of data analysis is to understand their meaning, so as the firm can understand where the improvement opportunity lies Parmenter, (2015). Analysis will encompass all the sales made through all the Skylock’s retail outlets so as to determine whether the objectives have been fully met.
It is vital to note, before adopting any strategy, the firm will evaluate and decide the frequency at which they will collect relevant data on the achievement of the plan. At the start, the first step will be to assess the market effectiveness, which will be done weekly, and then can go to monthly to reduce the evaluation cost and so on. This is important since it also ensures that the marketing goals are set, KPIs are defined, and people to collect and analyze data are determined.
Want help to write your Essay or Assignments? Click here
Management Structure and Incentive Scheme
The incentive scheme in the firm will be (a must) transparent, for all the staff members understand all the mechanism involved in the calculation. Simply because, a well-designed scheme has a powerful and positive effect, increasing the productivity, quality, and importantly efficacy of an institution Brealey, (2012). Conversely, a poorly designed staff incentive scheme will have a detrimental effect on the overall company performance.
Thus, the main objectives of this scheme will be achieved, which is increasing performance level, change the attitude and/or change the behavior of the staffs. Key to note, the introduction of incentive program results in an increase in revenue as well as boost the company’s reputation (which is one of our risks).
Staff incentive is paramount for the development of an institution and at the same time exciting. Some of the most benefiting parties of this strategy are the shareholders (owners), clients, employees as well as the creditors Brealey, (2012). To start with the owners, this includes even the Venture Capital and Private Equity investors, since the firm’s performance increases drastically through these measures. This aligns with the objectives of the owner, that is, to improve the achievement to a certain degree, and also reducing the standard financial performance. In other words, reducing the financial risks.
In addition, incentives should be directed to the management team of the institution. This is because the success of this organization and its reputation entirely depend on the managers. In other words, they have been delegated the duties of ensuring the firm’s objectives are met. Sometimes, this separation of management and ownership can be problematic as owners may lack means to make the managers perform their best to achieve the firm’s goals.
Further, the managers give the employees some duties, and they are supposed to make a decision and take actions. Thus, it is vital to ensure that incentives are designed in a way that even employees execute their duties are the top management will want.
The incentive scheme will motivate the whole team to work on achieving the organization’s goal. This will, on the other hand, increase the revenue return which in turn increases the cash the stakeholders receive for their capital contribution. To sum all up, the best strategic plans that Skylock Enterprise can adopt for their success have been well illustrated. This will make them more competitive, build a high reputation, and more importantly, increase their revenue, of which it is the core principle of establishing a business.
References
Ahlers, R., Schwartz, K. and Guida, V.P., 2013. The myth of ‘healthy’competition in the water sector: the case of small scale water providers. Habitat international, 38, pp.175-182.
Brealey, R.A., Myers, S.C., Allen, F. and Mohanty, P., 2012. Principles of corporate finance. Tata McGraw-Hill Education.
Cumming, D.J. and Johan, S.A., 2013. Venture capital and private equity contracting: An international perspective. Academic Press.
Danaher, P.J. and Rossiter, J.R., 2011. Comparing perceptions of marketing communication channels. European Journal of Marketing, 45(1/2), pp.6-42.
Dix‐Carneiro, R., 2014. Trade liberalization and labor market dynamics. Econometrica, 82(3), pp.825-885.
Horcher, K.A., 2011. Essentials of financial risk management (Vol. 32). John Wiley & Sons.
Want help to write your Essay or Assignments? Click here
Low-calorie Microwavable Food: Long term investment Decision
From the previous assignments, it was determined that the demand for low-calorie microwavable food is inelastic. The market for the product is also competitive meaning that the price of the commodity fluctuates from time to time. Therefore, the price of the low-calorie microwavable food can be made less responsive to market fluctuations or less price elastic in two ways. First of all is by making the product become more of a mass product that niche.
Secondly is to make its market rigid so that the clients for the product will have no alternative. This is because the customers will find no substitutes for the commodity and thus stick to it regardless of fluctuations (Brigham & Ehrhardt, 2013). The low-calorie microwavable food is healthy and convenient. To emphasize on these two main aspects, it is imperative to market and advertise the product with no close substitute by the two key attributes.
Government policies have both positive and negative impact on production and employment in the market. Governments always put in place rules and regulations that guide the way business is done in the market (Mason & Brown, 2013). These policies have an influence on profitability and competitiveness of business enterprises. Government policies act as market catalysts by changing the social behavior in the business environment.
By exempting some companies or particular sector in the economy from tax and duty, the government will be able to trigger investment and generate growth. On the same note, government policy helps to create political stability and hence promote local businesses as well as attract foreign investors.
Want help to write your Essay or Assignments? Click here
Government spending also has an effect on businesses, increased spending result in increased taxes that might discourage investment. Similarly, the government can influence the interest rates. An augment in interest rates add to the cost of borrowing. Therefore, it will discourage business because the entrepreneurs and business enterprises will not be in a position to obtain enough capital at a low price (Tricker, 2015). Low-interest rates, on the other hand, encourage investment.
Trade regulations also have an impact on business activities. Regulations such as the requirement for permits, federal minimum wage among others affect business practices. However, fair and effective regulation tends to promote business growth.
In our case, the government policies help to ensure that there is fairness in the microwavable food industry. Government involvement in the low-calorie, frozen microwavable food industry has led to fairness in the following ways.
Fair Competition: Government involvement in the industry has let to fair competition among the key players in the industries. Some firms often use unfair competitive strategies that may be of harm to other key players in the industry. For instance, use in predatory pricing strategies where firms set low prices to attract more customers and drive out other competitors who do not enjoy the economies of scale.
Large companies with high economies of scale can maintain low prices while small and medium-sized firms may not be in a position to maintain such low prices without incurring losses. Therefore, such small companies may end up quitting the market making the remaining large corporations enjoy monopoly power. As such, these strategies are unfair to small companies and thus the government comes in to regulate prices and protect small infant firms.
Want help to write your Essay or Assignments? Click here
Minimization of corruption through regulations: Government regulations often prohibit firms from taking advantage of their positions to ask for special treatment that can lead to their success in certain commerce or market economy. For example, some firms may bribe auditors to avoid scrutiny. Such practices are often illegal and unethical and result in unequal distribution of resources.
Undue advantage by some firms in the industry: Firms that are large and powerful often manipulate individual to gain favors at the expense of other firms. It is the requirement of the government to come up with regulations and rules that will ensure that there is an equal distribution of resources in the industry. The government should intervene and prosecute firms that take advantage of their position to make companies avoid such behavior. Therefore, it will enable companies in the low-calorie, frozen microwavable food to embrace legal and fair strategies that may not end up being unfair.
Therefore, government regulations have enabled the low-calorie, frozen microwavable food firm to enjoy fairness. Government regulations have enabled the company to have an equal opportunity of achieving tremendous success as long as it is in a position to develop legal and effective business strategies.
Similarly, government involvement in the industry helps to shield consumers from exploitation. It is the responsibility of the customer to ensure that products and services available to consumers are safe for consumption. In the same way, government develops rules that help ensure market efficiency and govern international trade.
Some of the major complexities that would arise under expansion via capital projects include:
Uncertainty: The process of capital budgeting is primarily based on future cash flow estimates. However, in the real situation, there are some uncertainties that can make a project fail. Capital budgeting analysis also utilizes multi-period model which lay down costs and benefits of more than one year. During this period, the cost or benefits factor may drastically change. Therefore, use of estimates and uncertainty, realities may result in complexities in capital budgeting (Kardes et al., 2013).
Discount factor: The process of capital budgeting is time-weighted. The future cash flow is often discounted using the present time discount rate. It is also difficult to choose a discount rate. Each project assumes a unique risk associated with itself making it difficult to approximate a discount rate for a project
Indivisibility: It is hard to divide a project. Therefore, a project must be taken up either in entirely or not at all.
Want help to write your Essay or Assignments? Click here
Evaluation is also a big challenge: There are different techniques that are used such as discounted techniques and non-discounted technique, when evaluation techniques conflict, business acumen, and manager’s prudence takes over the capital budgeting decision (Healy & Palepu, 2012).
In the case of low-calorie, frozen microwavable food company the big issue is the agency problem. This problem is because of the conflict of interest between the managers and the stockholders. Therefore, the microwavable food company can take the following steps to help bring convergence between the firm’s managers and stockholders.
First of all, the firm should align some part of the compensation package to the sales and profitability growth of the firm. Similarly, the firm should plan for stock options with the requisite T & C and provide it to the management to make them feel that they are part of the company (Grant, 2015). This way, the managers will be able to think for the betterment of the firm. Finally, the firm should develop a profit sharing plan that is linked to the performance of the managers.
By employing the above strategies, the firm will be able to motivate managers to work towards achieving the organization goals (Tricker, 2015). This is because the managers will begin perceiving their owned align with organization goals. Due to their hard work the firm will achieve growth in profitability, sales and profitability of the company. Increased sales will result in an increase in the compensation of managers. On the same note, it will increase the share price of the low-calorie, frozen microwavable food company. Therefore, both the managers and stockholders will mutually benefit.
Want help to write your Essay or Assignments? Click here
The name of the firm should not be used as an initiative of converging manager’s interest with those of the stockholders. The reason is that such strategy may result in copyright related issues. Be as it may, an organization with good HR practices can align the interest of managers, employees, and the stockholders. Performance management linked and motivation strategies such as bonus payment will also helps to converge the manager’s interest with those of the stockholders.
In conclusion, the low-calorie microwavable food can make its commodity less price elastic by making the product more of a mass product and making its market rigid. The government, on the other hand, helps in the regulation of the industry to ensure fairness in the low-calorie, frozen microwavable food industry (Mason & Brown, 2013). When it comes to capital expansion, firms face complexities because of uncertainty, discount factor, abandonment options, indivisibility and conflict between evaluation techniques.
Finally, the low-calorie, the microwavable food company can converge the company managers and stockholders interest by making the managers feel like they are part of the company and linking compensation schemes with the performance of the managers.
References
Mason, C., & Brown, R. (2013). Creating good public policy to support high-growth firms. Small Business Economics, 40(2), 211-225.
Want help to write your Essay or Assignments? Click here
Impacts of FDI on Employment in China
Introduction
Foreign Direct Investment (FDI) has been defined by different scholars, with the common definition referring to an investment where a firm gets acquisition and control over another foreign firm or such a firm set up its subsidiary in another foreign country. Taking many different forms, such investments could include mergers and acquisitions, intercompany loaning facilities, reinvestment of profits in foreign countries and development of new facilities overseas.
A clear distinction is drawn between FDI and portfolio investment, which involves the investments in the security of another country, either equity or debt securities (Sornarajah, 2011).
Due to the rapid changes resulting from globalization, better opportunities arise in the FDI arena. Foreign investments have flowed to different countries and had great impact on these countries’ economy. Developing countries, for instance, have endeavored to set policies that are competent and able to attract foreign investors. China, in its developing stages, managed to conceptualize the Reform and Opening Policy as early as 1978, a move that started revolutionary policy guidance for Foreign Direct Investment in China (Hale & Long, 2011, p. 16).
Since its beginning, FDI in China has undergone rapid developments. Within 1979 and 1986, a total amount of about $8.304 Billion was transacted as a result of FDI with the main players being Taiwan, Hong Kong and Macao (Chen, 2011, p. 93). This good trend was distorted from 1987 through 1991, when China’s legal system was unsound and incapable of attracting foreign investments
Want help to write your Essay or Assignments? Click here
Mainly referred to as the Rapid Development Stage, happened between 1992 and 1997 after China embarked on their socialist market economic system, hence improving tremendously the opportunities for investments. During this time, China’s FDI hit the highest at $196.7 Billion.
Though the following years witnessed a dwindling trend in FDI, this changed in 2001 to the present, due to China’s involvement in the World Trade Organization and its conducive environment that attracts investments internationally. Mostly, the main sectors which China concentrated on to stabilize their FDI included technology and telecommunications, banking, retail and wholesale growth.
Other than this, China promulgated new government policies that were business friendly. By the year 2011, the country had invested in over 400,000 enterprises that were internationally funded (Deng, 2013, p. 213). Apart from the inflow on FDI, there was massive effect of such investment to the indigenous firms in China. Such effects are referred to as spillover effects, which are usually divided into monetary and demonstration effects.
Due to their technological advancements, multi-national firms are competent compared to the local companies hence giving excessive competition grounds. As a result, local companies seek better managerial skills, technological equipment and production efficiency to meet the standards of the multinational companies (Zhang, et. al., 2016, p. 180). Despite being advantageous, this kind of competition between firms can be detrimental on the local firms, where multinational companies using technological advancements and productivity snatch market shares from local firms.
Want help to write your Essay or Assignments? Click here
There are various forms of FDI in China, including; equity joint ventures, wholly foreign-owned enterprise, joint exploration, FDI shareholding and contractual joint ventures. As its name may suggest, equity joint ventures are owned jointly by foreign and Chinese companies, individuals or other governmental organizations. Both companies manage the company together, hence sharing profits and risks together on determined scales as per capital contributions.
Contractual joint ventures, on the other hand, are somewhat similar to the equity joint venture, only that obligations and duties arising on the parties are laid off in a contract. Wholly foreign owned refer to foreign companies, individual and enterprise investments who establish themselves in China. In this scenario, all capital derives from such foreign firms. FDI shareholding involves the purchase of equity by foreign investors, hence leading to foreign invested enterprise.
Joint explorations, on the other hand, refer to various economic cooperation on the international arena, usually divided into exploration, exploitation then production. In many instances, joint explorations venture into exploitation of natural resources (OECD, 2013, p. 53).
Want help to write your Essay or Assignments? Click here
As earlier mentioned, FDI has a spillover effect. Particularly, FDI ensures creation of jobs, explained through the greenfield and brownfield analogies. Greenfield analogy can be explained as an investment that creates new production lines in host countries, through starting of a new company. Brownfield investment, in contrast, involves overseas mergers and acquisition. Due to its nature, brownfield investments cannot be certainly denoted as job openers, considering no new companies are created.
Another effect of FDI experienced in China is the crowding-effect, considering many multinationals are investing in the country. Local firms are overly pressurized to exhibit good performance, or risk winding up. This leads to severe pressure on employees. The inter-dependency between FDI and employment is usually affected by diverse variables, including population, exports and growth of domestic economy (Michael, 2013, p. 24).
Literature review
In the recent years, China has been trying to support the foreign direct investment to enhance its purchasing power via wages and to create job opportunities. Through understanding factors that impacts on employment, particularly those associated with FDI, China can realize its potential expansion of its productive sector and the required production innovation techniques to improve its economy.
It is because FDI can create jobs through the direct hiring of individuals for the new industries. Moreover, the enhanced aggregate domestic employment via various types of jobs created, income distribution, wages levels, and skills transfer will result in indirect effects. The increased FDI inflow to China has led to the creation of many job opportunities, and as a result, many people have been employed (Hu, 2011).
Therefore, FDI has positively impacted on employment in the long-term since individuals who could have been unemployed, now can have jobs. However, since FDI bring new business culture and technology, its influence relies on the interaction between the growth of the productivity, labor specialization, and output growth.
Want help to write your Essay or Assignments? Click here
FDI has led to the improvement of technology, skills, and trade in the long-term in China. Moreover, it has facilitated adverse effects on jobs and wages as realized in China in the short-term. The findings in China in both secondary and tertiary firms for the period 1985-2008 indicated that FDI growth led to the creation of employment, enhanced skills and technology, and trade for the period.
FDI needed high-skilled personnel to work in their organizations that had sophisticated technologies, hence, necessitated an individual to acquire skills that matched FDI requirements, making one to have improved skills in the end. However, in situations where there was a bidirectional linkage between employment and FDI, in the short-term, FDI led to the loss of jobs because of displacements of workers, according to Liu (2012).
Furthermore, on one hand, new technology made industries more competitive that allowed them to employ more employees and to grow. On the other hand, new technology led to decrease in demand because of substitution of many low-skilled workers by fewer high skilled employees. Therefore, new technology had both merits and demerits attributed to job creation and employment.
Want help to write your Essay or Assignments? Click here
Recent empirical evidence studies show that China should not expect to have any job opportunities despite the benefits she gets from FDI (Zia & Rizvi,2011). It is because elasticity growth associated with employment in China is extremely low, which makes employment enhancing policies be priorities. Initially, when foreign investors and their companies came, many people were employed, but over time the rate of absorption became low. T
he new companies were able to attain the required number of employees in their organizations with time, meaning new people could not be employed leading to low elasticity growth associated jobs.
When China is studied using the two-sector dual economy model to show the influence of foreign investment on domestic capital accumulation and underemployment, it shows that foreign investment lower manufacturing sectors in the long-term. The manufacturing sector decline because some of the local companies were not able to compete adequately with foreign organizations associated with FDI as they had a lower level of technology and skills.
FDI also had a large effect in the high-wage manufacturing firms than on a one-for-one basis and crowds out domestic capital. The study of FDI effect using analysis of panel information to find labor demands roles for white and blue collar employees showed that FDI had significantly positive outcomes. However, the positive effect, especially with the blue-collar jobs, declined with the rise of the skilled intensity of manufacturing companies (Liu, 2012).
According to Duan (2011), labor market, market size and market potential, clustering and cluster, macroeconomic policies, openness, and scientific research level account for the reason of determining the FDI location. Labor productivity and labor costs also influence FDI location, which indicates that improved workforce skills level attracts FDI. Thus, FDI favors high-skill workers because they are the ones mostly likely to get employed in the new job markets, and makes low-skill workers liable to lose their employments due to replacement.
Want help to write your Essay or Assignments? Click here
Ownership that is so crucial in the creation of the jobs affects employment in China. Research indicates that the major reason for inadequate employment creation is because the state own enterprises absorb employees quickly than the private sector. The low absorption rate is attributed to the fact that both joint ventures and foreign-owned multinationals that are supposed to employ many people belong to the private sector.
Thus, it means that the private sector has a higher capacity of creating more employment opportunities when compared to the state-owned enterprises (Sjoholm, 2011). In a similar analysis of employment, Hale & Long (2012) found out that FDI indirectly and directly impacts jobs. According to them, FDI can directly increase jobs and indirectly lower jobs by improving productivity levels indirectly and supplanting domestic investment. However, when the effects of the two are combined, FDI has significant positive influence in China.
Liu (2012) analyzed the effect FDI has on employment creation in China as far as manufacturing companies are concerned. Liu relied on the industry-level data in the Chinese manufacturing industry for the period 2000-2009. Also, Liu presented an analysis of direct and indirect job impacts. The findings indicated that both the private domestic industries and FDI have higher employment growth than the non-private domestic companies in China.
Furthermore, firms with other types of ownerships had less advantageous features than the FDI, in particular, their access to the export market, when the cross-ownership comparison is done. The conclusion was that FDI had led to employment creation in the Chinese manufacturing sector.
Want help to write your Essay or Assignments? Click here
The impact of FDI on employment may not be beneficial to China. Hu (2011) illustrates that when crowding-out is taken into consideration, the crowding-out only becomes significant when foreign multinational enterprises focus on the recipient nation’ market. It is because the FDI influx may bring in more pressure on domestic firms. Moreover, the external investment requires higher efficiency and better technology, which implies that it will only need fewer employees than before, making the crowding-out effect of FDI lead to more workers being laid off as a result of more of the domestic companies going bankrupt.
Zia & Rizvi (2011) indicate that FDI has more favorable when China faces economic crises. It is because FDI has an advantage over other investments programs such as loans or portfolio as it often prove to be more resilient in times of economic crisis. The other types of investment are subject to large reversal when there is a financial crisis. Thus, economic crisis presents a major challenge to employees and employment.
Workers who are employed in other types of investment are more likely to be laid off because their organizations may go bankrupt, which is unlikely of FDI that is more resilient and stable in an economic crisis. In this scenario, FDI positively impacts on employment in China because workers are not likely to lose their jobs due to the economic crisis.
FDI has also led to the loss of employment among people in China, according to Zia & Rizvi (2011). The increased competition associated with FDI’s international corporations has pushed out some of the more productive local business enterprises as they are not able to compete. It is because the local business enterprises have lower technology and skills in most cases than the FDI’s companies making them less favorable to compete in the market.
Therefore, the increased competition brought in FDI has led to the loss of jobs, rather than creating. Moreover, it illustrates that FDI does not contribute to local economy development because the increased competition associated with FDI leads to people being laid off in local business ventures.
Want help to write your Essay or Assignments? Click here
The amount of FDI in China increased by 225.20 USD HML between December and February 2016. This is according to data the ministry of commerce of the people’s republic of china. The country averaged 416.01 USD HML between 1997 and 2016 hitting an ultimate high of 1262.7 HML in December 2015.
Labor is affected by a variety of factor in an economy both from either side of the border of the economic space of a country or an economy. Empirical research has given much more attention to the effects of trade on labor markets than to the impacts of FDI on employments. Analysis on the effect of FDI on employment is thus more complicated.
A large number of studies have been conducted that try to establish whether OFDI substitutes or complements domestic jobs and this is split into two. In the home employment effect of foreign direct investment: from empirical results, China’s OFDI contribution to the employment of the country is a noticeable difference in the studies conducted over time. It was found that FDI can stimulate exports thus, in turn, achieving more employment.
These multinationals, in the process of processing trade of foreign investments, source most of their materials from the domestic markets. This are raw materials, spare parts and other half finished products. This increases the demand for these goods in the domestic market hence raising the employment in the different industries producing them and those related to them.
However, with the surplus of china’s labor being serious and FDI still being at a start stage, many investments belong to the defensive industry. These investments cause an increase in the demand of domestic capital and goods thus edging out domestic investments from the market.
Research also shows that china’s FDI does not influence employment in the primary industries but gives a significant effect in secondary and tertiary industries. With the composition of capital in the tertiary industries being comparatively small, labor is higher compared to other industries at similar investment levels thus FDI achieving more influence in tertiary sectors.
Want help to write your Essay or Assignments? Click here
Research done on the effect of FDI on the home country have elicited mixed results. Research dealing in detail with the employment effect of FDI found a substitution effect between a foreign subsidiary’s activity and its parent’s employment. These studies have majorly concluded that change mainly occurs between countries with comparable endowments. This thus implies that low-wage countries make better substitute among themselves than.
Studies indicate that American multinationals are employing vertical FDI seem to be reducing employment back home compared to production by transferring labor intensive stages of their production processes to their affiliates in developing countries. Other studies have concluded that labor substitution is more likely to take place when factor proportions are different in various locations and vertical FDI prevails. The second group of research has found that the complementary effect prevails, this noted a positive effect on employment due to an affiliate activity in the host country.
The main reason behind this is that the opportunity to invest in a low-cost host country could increase the firm’s competitiveness, promote its use of economies of scale, and reduce its costs, which may lead to an increase in home-country employment.
This brings the picture of a scale effect dominating over a substitution effect for the parent country’s firms and the parent country’s employment. In the North American car industry, studies have found that jobs in Japan were growing as a consequence of investing abroad. This is explained as the result of allocating labor intensive production to developing countries thus increasing supervisory and ancillary employment to mainly service foreign operations.
According to Hu (2011), the two factors affecting employment are economic development and capital stock, with capital stock encompassing both domestic and foreign FDI.
Want help to write your Essay or Assignments? Click here
The third group of studies shows that outward investments can increase the demand and wages for skilled labor in both the parent and host countries. This is attributed to the differences in labor demand in both countries
Nunnenkamp, Bremont and Waldrich (2011) posed the question on whether foreign direct Investment contributed to employment creation in Mexico. An analysis of FDI and employment data covering manufacturing firms in Mexico were used. From this, they estimated the dynamic labor demand functions for blue and white collar workers, including both FDI and its interaction with major industry characteristics.
Using the GMM estimator proposed by Nunnenkamp, Bremont and Waldrich (2011) they accounted for the relatively short time dimension of the panel data (1994-2006). It showed that FDI had a positive though the quantitatively modest impact on manufacturing employment in Mexico. This was in contrast to a widely held view applying to both white collar and blue collar jobs.
Want help to write your Essay or Assignments? Click here
Hu (2011) found that it is very difficult to assess the outcome of FDI on employment in European nations mainly due to the different stages of economic development in the countries. According to him, the first stage of FDI is characterized by elimination unproductive jobs giving way to new productive jobs.
This is mainly due to the restructuring of jobs by extensive mechanization and automation leading to loss employment while the organisations became better and more profitable. From these, the multinationals create a better and more productive labor force. This process of creatively destroying labor ends up creating a more positive effect on employment. Finally, it is found that the research shows that FDI is not a golden wand to the creation of jobs.
Liu (2012) using data collected between 1986-2010, concludes that that the effect of FDI on employment was positive before 1996, but the effect was not noticeable after 1996.
According to established theory, the activities of affiliates can be related to the motives of FDI, namely efficiency seeking, market seeking and strategic-asset-seeking flows. The impact of these types of FDI on trade patterns are explained by distinguishing four kinds of trade linkages between the parent firm and her affiliates:
The substitution of former exports through FDI
Growing (re-)imports of goods and services produced abroad
FDI associated exports of goods and services
FDI induced exports of other product lines neither generated by the foreign affiliates nor exported earlier by the parent
Want help to write your Essay or Assignments? Click here
The overall impact of FDI on domestic employment is the sum of negative (export substitution, re-imports) and positive effects (associated and induced exports) and can be tested only empirically. Any distinction between direct and indirect FDI is justified only if their trade linkages differ. In a broad view, the literature reviewed shows that MNE (Multinational Enterprises) employment can promote growth and poverty reduction in host countries in four ways.
(i) Multinational Enterprises job has a direct and indirect impact on domestic employment: this is through direct employment and indirect employment through forward and backward linkages in the local firms.
(ii) Multinational Enterprises employment boosts wages in host countries:
A number of studies have shown that Multinational Enterprises pay higher wages than local firms even after controlling for firm and worker characteristics. The presence of multinationals will also at times cause wages to be higher in industries and in provinces that have a higher foreign direct investment
Through labor turnover, technology gets diffuse into the host countries as domestic employees move from foreign firms to local companies.
(iv) Multinational enterprises employment enhances labor force productivity in host country:
Several studies have shown that workers in foreign-owned enterprises are more productive than workers in domestically owned enterprises.
Want help to write your Essay or Assignments? Click here
Methods
Time series and AUTOREG process in SAS were used to access historical association between the inflows of FDI and employment in China. Since, dependent and independent variables are time series data, model error has a significant probability of not being independent based on time The AUTOREG procedure measures and predicts linear regression for time series in the event that errors are Autocorrelated.
Dependent and independent Variables
As indicated early, FDI has led to crowding-out influence on employment, as such an essential indicator of job opportunities. Besides FDI, various variables may impact employment including GDP, interest rates and wages. Some of the components of GDP include government expenditure, consumption, value of net exports and investment (Mankiw, 2012). The thesis uses China’s Statistical Yearbook that has FDI as an investment element.
For that reason, the assessment was performed using GDP values from this Statistical yearbook and provided values of GDP subtracted with FDI. The results were then utilized in testing the association between GDP and employment. For easier understanding, model outcomes of GDP are obtained from Statistical Yearbook of China. The estimates of the model are similar, with same independent variables under the requirements of alternative model. The model outcome of GDP with no adjusted FDI is demonstrated in analysis section.
Want help to write your Essay or Assignments? Click here
Moreover, since China’s FDI information from World Bank beginning in 2005 demonstrate considerably amounts in comparison to Statistical Yearbook, however, employment and GDP are similar in these sources, models were evaluated using FDI and other variables from World Bank and Statistical Yearbook respectively. The results are demonstrated in table 1.
Table 1: Chinese National Economy Data
Year
Emplo yment (100mi llion)
FDI
FDI ˄World Bank˅
GDP
GDP- FDI
total wage
intere st rate for depos its
intere st rate for loans
Exchan ge rate
1985
4.9873
19.56
16.59
2943.0 7
2923.5 1
430.9 1
8.28
7.92
3.2095
1986
5.1282
22.44
18.75
2816.2 3
2793.7 9
444.7 9
9.36
7.92
3.7314
1987
5.2783
23.14
23.14
3290.2 9
3267.1 5
504.1 3
9.36
7.92
3.7314
1988
5.4334
31.94
31.94
4124.0 9
4092.1 5
620.7 3
10.80
13.32
3.7314
1989
5.5329
33.92
33.93
4113.1 1
4079.1 9
622.1 5
14.94
19.26
4.2088
1990
6.4749
34.87
34.87
3695.7 1
3660.8 4
563.7 0
11.52
11.16
5.2352
1991
6.5491
43.66
43.66
4162.9 6
4119.3
612.8 8
9.00
9.72
5.4234
1992
6.6152
110.0 8
111.56
4739.0 5
4628.9 7
677.2 3
9.00
9.72
5.8166
1993
6.6808
275.1 5
275.15
6345.6 6
6070.5 1
844.5 6
12.06
12.24
5.8210
1994
6.7455
337.6 7
337.87
5906.2 7
5568.6
782.8 8
13.86
14.04
8.5024
1995
6.8065
375.2 1
358.492
7584.4 2
7209.2 1
966.4 9
13.86
14.04
8.3351
1996
6.8950
417.2 6
401.8
8904.2 7
8487.0 1
1076. 29
12.06
15.12
8.3290
1997
6.9820
452.5 7
442.37
9874.0 6
9421.4 9
1161. 11
6.66
10.53
8.2700
1998
7.0637
454.6 3
437.51
10463. 32
10008. 69
1228. 04
6.66
8.01
8.2700
1999
7.1394
403.1 9
387.53
11018. 74
10615. 55
1324. 66
2.88
6.21
8.2700
2000
7.2085
407.1 5
383.993
11940. 63
11533. 48
1324. 63
2.88
6.21
8.2700
2001
7.3025
468.7 8
442.41
13183. 56
12714. 78
1475. 86
2.88
6.21
8.2700
2002
7.3740
527.4 3
493.079 766
14567. 79
14040. 36
1649. 11
2.79
5.76
8.2700
2003
7.4432
535.0 5
494.568 471
16519. 16
15984. 11
1853. 64
2.79
5.76
8.2700
2004
7.5220
606.3 0
621.080 43
19462. 7
18856. 4
2129. 99
3.60
6.12
8.2700
2005
7.5825
603.2 5
1041.08 694
23208. 33
22605. 08
2554. 22
3.60
6.12
8.0757
2006
7.4978
630.2 1
1240.82 036
28471. 13
27840. 92
3101. 64
4.14
6.39
7.8224
2007
7.5321
747.6 8
1562.49 335
36166. 7
35419. 02
3998. 09
4.41
6.39
7.3714
2008
7.5564
923.9 5
1715.34 65
46083. 95
45160
5147. 09
5.58
7.47
6.8565
2009
7.5828
900.3 3
1310.57 053
51082. 38
50182. 05
5900. 70
5.58
7.47
6.8227
2010
7.6105
1057. 35
2437.03 435
60602. 15
59544. 8
7111. 57
4.20
6.14
6.6469
2011
7.6420
1160. 11
2800.72 219
73453. 39
72293. 28
9455. 83
5.00
6.60
6.3405
Table 2 Chinese National Economy GDP Disaggregated Data
Unit (100 million US$)
Year
Gross Domestic Product
household expenditure
government expenditure
Gross capital formation
Net export
1985
1460.48
404.70
1077.27
0.62
1986
1420.94
407.27
1056.41
-68.39
1987
1641.77
449.83
1195.80
2.89
1988
2108.62
528.33
1527.63
-40.49
1989
2093.85
558.73
1504.63
-44.10
1990
1805.26
504.20
1288.78
97.47
1991
1978.57
619.78
1450.75
113.86
1992
2235.00
722.62
1734.05
47.38
1993
2819.46
942.76
2700.17
-116.73
1994
2569.18
870.11
2392.40
74.58
1995
3403.64
1005.21
3055.76
119.81
1996
4076.83
1196.25
3455.99
175.20
1997
4464.51
1356.60
3623.70
429.25
1998
4743.57
1494.43
3786.48
438.84
1999
5068.97
1658.59
3984.46
306.72
2000
5544.69
1893.76
4213.16
289.02
2001
5977.74
2115.84
4808.88
281.10
2002
6415.55
2268.43
5509.67
374.14
2003
6970.96
2422.70
6766.99
358.51
2004
7886.15
2700.62
8363.77
512.16
2005
9034.35
3268.92
9640.88
1264.18
2006
10556.29
3902.69
11883.06
2129.09
2007
13068.41
4870.23
15050.50
3177.56
2008
16286.79
6089.42
20174.33
3533.41
2009
18100.47
6691.89
24087.65
2202.37
2010
21176.58
8027.25
29126.95
2271.37
2011
26014.54
10033.29
35487.21
1918.35
Data Source: China statistical yearbook.
Table 3 Chinese Economy Primary Sector Source Data
Unit (100 million US$)
Year
Employment (100 million)
FDI
GDP
GDP-FDI
Total Wage
1997
3.484
6.2763
1746.3
1740.02
31.78
1998
3.5177
6.2375
1791.73
1785.49
30.22
1999
3.5768
7.1015
1786
1778.9
30.58
2000
3.6043
6.7594
1807.1
1800.34
31.45
2001
3.6513
8.9873
1908.26
1899.27
32.43
2002
3.687
10.2764
1999.64
1989.36
33.63
2003
3.6546
10.0084
2101.78
2091.77
40.6
2004
3.5269
11.1434
2589.21
2578.07
42.46
2005
3.397
7.1826
2776.23
2769.05
45.65
2006
3.1941
5.9945
3073.23
3067.24
51.56
2007
3.0731
9.2407
3883.52
3874.28
63.03
2008
2.9923
11.9102
4915.34
4903.43
75.32
2009
2.889
14.2873
5159.28
5144.99
78.71
2010
2.7931
19.1195
6098.12
6079
94.34
2011
2.6594
20.0888
7489.35
7469.26
110.03
Data Source: China statistical yearbook.
Table 4 Chinese Economy Secondary Sector Data
Unit (100
million US$)
Year
Employment (100 million)
FDI
GDP
GDP-FDI
Total Wage
1997
1.6547
325.6989
4539.66
4213.96
556.41
1998
1.66
313.2749
4716.35
4403.08
514.97
1999
1.6421
277.8432
4961.74
4683.9
521.02
2000
1.6219
295.798
5508.57
5212.77
546.18
2001
1.6284
348.0844
5986.98
5638.9
575.7
2002
1.578
394.7185
6517.14
6122.42
627.26
2003
1.6077
391.9696
7549.94
7157.97
719.88
2004
1.692
454.6306
8936.43
8481.8
831.48
2005
1.8084
446.9243
10847.12
10400.2
1009.74
2006
1.8894
425.066
13259.3
12834.2
1248.39
2007
2.0186
428.6105
17070.21
16641.6
1587.29
2008
2.0553
532.5624
21731.71
21199.1
2018.55
2009
2.108
500.7582
23088.12
22587.4
2272.02
2010
2.1842
538.6037
28191.07
27652.5
2789.19
2011
2.2544
557.487
34762.69
34205.2
4030.86
Data Source: China statistical yearbook.
Table 5 Chinese Economy Tertiary Industry Data
Year
Employment (100 million)
FDI
GDP
GDP-FDI
Total Wage
1997
1.8432
120.5952
3263.38
3142.78
549.09
1998
1.886
135.1151
3697.76
3562.64
578.94
1999
1.9205
118.2424
4095.94
3977.7
642.53
2000
1.9823
104.5907
4681.25
4576.66
710.91
2001
2.0228
111.7042
5361.16
5249.46
822.43
2002
2.109
122.4337
6033.72
5911.29
930.53
2003
2.1809
133.0687
6772.03
6638.96
1093.16
2004
2.3011
140.5258
7806.69
7666.16
1256.05
2005
2.3771
149.14
9277.12
9127.98
1498.82
2006
2.4143
199.0819
11320.68
11121.6
1801.7
2007
2.4404
309.8277
15105.94
14796.1
2347.77
2008
2.5087
379.4812
19155.54
18776.1
3053
2009
2.5857
385.2817
21681.98
21296.7
3549.97
2010
2.6332
499.6292
26116.83
25617.2
4228.04
2011
2.7282
582.5342
32329.08
31746.5
5314.93
Data Source: China statistical yearbook.
Unit (100 million US$)
Model outcome of industry with respect to GDP without FDI are indicated in table 6
Table 6: Chinese National Economy Normal Least Squares Results
The AUTOREG Procedure
SSE
2.74028586
DFE
18
MSE
0.15224
Root MSE
0.39018
SBC
44.5152978
AIC
32.852766
MAE
0.22047964
AICC
43.4410013
MAPE
3.56510991
HQC
36.3206481
Durbin-Watson
0.7275
Regress R-Square
0.8492
Total R-Square
0.8492
Variable
DF
Estimate
Standard Error
t Value
ApproxPr > |t|
Intercept
1
5.4839
0.8842
6.20
<.0001
FDI
1
0.003170
0.001355
2.34
0.0310
household
1
-0.000139
0.000722
-0.19
0.8497
government
1
0.001427
0.001350
1.06
0.3044
GCF
1
-0.000182
0.000230
-0.79
0.4394
export
1
-0.000146
0.000220
-0.67
0.5144
wage
1
-0.000588
0.000951
-0.62
0.5443
deposit
1
0.006644
0.1214
0.05
0.9569
loan
1
0.0137
0.0893
0.15
0.8795
Additionally, wages influence employment. A number of studies have assessed the connection between wages and employment. Wages cannot affect employment, in other words, reducing real wages in not useful to increase job opportunities. On the contrary increased job opportunities do not affect wages. When job opportunities increase, it implies that increased demand while reducing real wages. Interest rates also affect employment.
For instance, a decrease in interest rate on deposit means that individuals will deposit less hence promote consumption in households while promoting production and recruitment as the market will require additional employees. In contrast, when there is a reduction of interest rate on loans, producers will borrow from banks at reduced costs thus assist in expanding production and a nation will need extra employees.
Want help to write your Essay or Assignments? Click here
Sources of data
In this study, to assess the connection between FDI and employment in China, eight independent variables were used including wages, FDI, government expenditure, consumption, net exports, investment, interest rates for loans and deposit from 1985 to 2011.
In china, the Reform and Opening Policy was introduced in 1978, a period when FDI started to flow. Nonetheless, as a result of inadequate information on FDI, interest rate for deposit and loans, wages while ensuring that independent variable , data was collected from similar source as well as period- 1985to 2011.When it comes to statistical analysis, three major industries in the economy of China, information on four elements of GDP and interest rates for loans and deposit was not available.
Want help to write your Essay or Assignments? Click here
Additionally, in the analysis of three major sectors; GDP, FDI and wages were used as independent variables. Information on industry analysis was available for 1997 to 201. And for national economy and industry analysis dependent variable was similar – number of employed individuals, which was represented as 100 million employment opportunities.
Consequently, original Chinese information source FDI units, household spending, net exports, wages, government spending and gross capital are represented by 100 million US dollars. On the other hand, household spending, net exports, wages, government spending and gross capital are represented based on Chinese currency RMB. To ensure that there is uniformity in the information, exchange rate for RMB to USD from 1985 to 2011 was employed to convert RMB to 100 million USD. The interest rates units are expressed as a percentage.
Owing to the fact that each industry has various units/sectors, the primary, secondary and tertiary data values are the totals of every sector in each industry. The primary sector comprises of forestry, agriculture, fishing and animal husbandry while the secondary industry involves manufacturing, mining, supply of water, gas, and waters. Addition, tertiary industry represents other sectors not in the primary and secondary industries.
Some of these sectors are storage, transport, information dissemination, hotels and catering; realtor, scientific research and so forth (China Statistical Yearbook).For that reason, the useful data for primary, secondary and tertiary sectors, and FDI information and wages were estimated. GDP information is collected from China’s yearbook. Information for the China’s economy is illustrated in Table 1 and Table 2. Table 3 presents primary sector data and Table 4 and Table 5 represents secondary and tertiary sectors for the economy of china respectively.
Want help to write your Essay or Assignments? Click here
Results
Data analysis was performed using AUTOREG procedure to demonstrate the connection between independent and dependent variables of employment. The modeling approach changes due to inadequate interdependence of data values as well as estimation error through modeling errors as lag-one autoregressive, or AR(1), framework. According to the model errors in the analysis, it demonstrates cases of moderate level of skewedness for particular model while approximating normality in certain cases.
Much as heteroskedasticity of errors is not directly tackled, AUTOREG process id developed to deal with such issues; based on the fact that there is insufficient volatility in the information to assess the models.
Findings for the national economy of China
Based on the findings from the overall economy of China, it is evident that independent variables including household spending, FDI, gross capital, government spending wages, net capital and interest rates of loans and deposits have a significant relationship with employment- the dependent variable. According to estimations from Ordinary Least Squares, 84.95 percent of changes in employment can be forecasted by independent variables (table 6).
In addition, from Maximum Likelihood that involves adjusted Autocorrelated errors, there were about 95.89 percent changes in employment, which can be estimated by eight predictor variables (Table 7). The association between every independent as well as dependent variable is illustrated in Tables 6 and 7. Since the information is focused on 27 year while standard errors are huge compared to large datasets, estimations demonstrate that particular p-values are more than 5%.
Want help to write your Essay or Assignments? Click here
Using, Ordinary Least Squares, it is clear that there is a strong correlation between FDI and employment- with a p-value of 0.031. There is no evident association between dependent variable and household spending, FDI, gross capital, government spending wages, net capital and interest rates of loans and deposits (Table 6 With respect to Maximum Likelihood that comprises of the impacts of autoregressive lag-1 framework there is a negative correlation between employment and interest rates loans, because the p-value is more than 5% at 0.0616.
While this is not a strong relationship, it indicates and provides areas fro further studies in future. Again, there is no correlation between employment and other independent variables (Table 7). First-order autoregressive or AR (1) model is utilized to address trends of high serial reliance within data. It is estimated at -0.9779 with a Pearson value of less than 0.0001. This suggests that independent errors associated with data for one time though closely associated. in other words, every year independent error is closer to the previous year’s error.
Based on Maximum Likelihood and Ordinary Least Squares, the association between independent and dependent variables are not similar. In the Ordinary Least Squares, there is a strong correlation between dependent and independent variables (Table 6), this is because the p-value is at 0.031 while estimate for parameter at 0.00317. On the other hand, for Maximum Likelihood, there is no significant correlation between employment and FDI; however, there is a negative association between employment and interest rates for loans (Table 7), since the Pearson value and parameter estimates at 0.0653 and -0.0653 respectively.
This variation is due to Maximum Likelihood put into account First-order autoregressive procedure and also the impact of independent variables that significantly affects parameter estimations of every predictor variable. This result indicates that putting into account autoregressive framework, the impact of FDI weakens while interest rates for loan demonstrate a significant influence on employment. Residual analysis is shown in Figure 6.
Residual analysis is important when it comes to measuring the variation between estimated and observed values for every year employment level. For employment- the individuals employed in China, every year’s residual is at -1 and 1 apart from 1988 to 1990. In other words, the observed and estimated values are closely, other than in 1988 t0 1990.
According to lag framework, the probability of white noise reduces as the lag time increases, when the lag period increase, it becomes challenging to forecast employment level. The autocorrelation function is a trend of autocorrelation in a given time series at several lags while the partial autocorrelation function is the trend of incomplete autocorrelation in any given time series at different lags
Findings for primary, secondary and tertiary sectors of the economy of China
In the primary sector it is evident that 3 independent variables including FDI, wages and GDP have a significant correlation with employment. With Ordinary Least Squares estimation, 97.36% of difference in the employment is described by these variables as demonstrated in Table 8while Maximum Likelihood represents 97.39 percent of difference in employment (Table 9).
Since the data used is fifteen year data, it is intricate to achieve a small Pearson value, which demonstrates a positive statistical association. With regards to Ordinary Least Squares, there is a strong connection between employment and FDI as the p-value is at 0.001. In addition, the Maximum Likelihood, there is a strong relationship between employment and FDI because the Pearson value is at 0.005.
When it comes to secondary industry, 3 independent variable such as GDP, FDI and wages have a strong correlation with employment. The Ordinary Least Squares, 96.63 percent and Maximum Likelihood estimations indicate that 97.91percent changes in employment level can be forecasted by wages, FDI and GDP (Table 4.5 and 4.6). Much as the Ordinary Least Squares value indicate that there is a strong connection between employment and FDI since the Pearson value is 0.0007, there is a strong negative association between employment and wages with a p-value of 00187 and -0.000276 parameter estimates.
Again, Maximum Likelihood demonstrates a strong positive association between FDI and employment since the p-value is less than 0.05 at 0.027 and parameter estimates at 0.0000461. While the there is no statistical significance between employment and wages, Maximum Likelihood is similar to Ordinary Least Squares Figure 8).
Want help to write your Essay or Assignments? Click here
In the tertiary industry, there is a strong correlation between 3 independent variables- wages, FDI and GDP. Ordinary Least Squares results shows 95.16 percent of difference in the employment level, which is due to these variables while Maximum Likelihood demonstrates a 98.27 percent of change in employment level, which can be described by wages, FDI and GDP.
In Ordinary Least Squares values, there is a negative association between FDI and employment, because the Pearson value is greater than 0.05 at 0.0251 and parameter value at -0.002095. There is a strong negative connection between wages and employment with Pvalue and parameter estimation at 0.0264 and -0.001326 respectively. However, there is a significant correlation between employment and GDP since Pearson value is at 0.0046 and parameter estimate at 0.00312.
Based on Maximum Likelihood outcome, the parameter estimations demonstrates a negative correlation between employment and FDI because the p value is more than 0.05 at 0.0251 and strong association between GDP and employment with a p value at 0.0604. The strong negative association between employment and wages in the Ordinary Least Squares results is not significant in Maximum Likelihood results (Figure 9).
To guarantee that these correlations are precise, further estimations were performed by subtracting FDI from GDP, rather than using GDP information from Chinese Statistical Yearbook to establish the reported association between employment and independent variables of primary, secondary and tertiary industries of China’s economy.
Want help to write your Essay or Assignments? Click here
These results are similar to the above results. Nonetheless, the new outcomes will assist in verifying the validity of previous relationships. Furthermore, FDI information collected from Chinese Statistical Yearbook were evaluated against those from World Bank to guarantee that past outcomes are in line with other sources of information. The results of primary industry demonstrate that with careful consideration of autoregressive system, the strong correlation between employment and FDI is still strong.
This confirms that without doubt FDI has a positive influence on employment in the primary industry. In the secondary industry, Ordinary Least Squares and Maximum Likelihood estimates demonstrate a similar correlation between independent and dependent variables, therefore, GDP as well as wages affect level of employment, where GDP has a strong relationship while wages has a negative correlation.
In the tertiary industry, the negative association between wages and level of employment is not statistically significant in Maximum Likelihood; GDP has a strong correlation on the employment in Ordinary Least squares; and GDP is closely a strong independent variable of employment in Maximum Likelihood. Apparently, FDI has a negative impact on employment in the tertiary industry. For the general economy of China, there is no strong correlation between FDI and employment; and there exists a strong negative association between interest rates on loan and employment.
Chen, C. 2011. Foreign Direct Investment in China: Location Determinant, Investor behavior and Economic Impact. Amazon: Edward Elgar Publishing.
Deng, Z. 2013. Foreign Direct Investment in China: Spillover Effects on Domestic Enterprises. New York: Routledge Publishers. draw amid world decline. United Nations Conference on Trade and Development report. The Wall Street Journal Eastern Edition, p. A8.
Duan, J. 2011. Location on Determination of FDI in China (1986-2009).
Hale, C., & Long, C. 2012. Foreign direct investment in China: Winners and losers.Singapore: World Scientific Publishing.
Hale, C., and Long, C. 2012. Foreign direct investment in China: Winners and losers. Singapore World Scientific Publishing.
Hannon, P., & Reddy, S. 2012. China edges out U.S. as top foreign-investment
Hu, B. 2011. An empirical research on impacts of FDI upon employment in China. Economy and Management, (9), 12-16.
Liu, B. (2012). Effect of FDI on employment in China. Modern Business Trade Industry, (17), 10-11.
Liu, L. 2012. FDI and Employment by Industry: A Co-Integration Study, Modern Economy, Vol. 3 No. 1, pp. 16-22.
Michael, H. (2013). Foreign Direct Investment in China: Theories and Practices. New Jersey State: Routledge Publishers.
OECD, (2013). Southeast Asian Economic Outlook 2013 With Perspectives on China and India. New Jersey: OECD Publishing.
Sjöholm, F. 2011. The Effect of FDI on Employment and Technology in China. Research Institute of Industrial Economics and Örebro University
Sornarajah, M. (2011). The International Law on Foreign Investment. United Kingdom: Cambridge University Press.
Zhang, L., LeGates, R. & Zhao, M. (2016). Understanding China’s Urbanization: The Great Demographic, Spatial Economic and Social Transformation. New York: Edward Elgar Publishing.
Zia, S., and Rizvi, A. 2011. The Impact of Foreign Direct Investment on Employment Opportunities: Panel Data Analysis. Institute of Business Management.
Want help to write your Essay or Assignments? Click here
Want help to write your Essay or Assignments? Click here
Performance Analysis
Business Analysis Report:
Abstract
This report provides an exhaustive comparative appraisal of the fiscal position, cash flows, performance, and evaluation of Bellway PLC and Redrow PLC. These are two companies that both operate in United Kingdom’s real estate industry. The report sought to answer the following questions: Is Bellway in a better financial position than Redrow? Which company is more profitable for investors between Bellway and Redrow? Which of these two companies is better positioned to exploit the opportunities in its environment? The results indicate that Bellway is better positioned fiscally than Redrow in case an emergency situation comes up. All the same, Redrow is better positioned to exploit the opportunities in its environment than Bellway.
Business analysis report
Introduction
This report provides an in-depth comparative appraisal of the fiscal position, cash flows, performance, and evaluation of two companies that operate within the same industry. In analyzing the main financial statement of the two companies, the researcher uses ratio analysis, vertical analysis, and horizontal/trend analysis. The selected firms are Bellway PLC and Redrow PLC. Both of these companies operate in the United Kingdom’s home construction industry. This appraisal comprises SWOT analysis for both Bellway and Redrow.
The two selected companies are described briefly in the introduction section and a fuller description is found at the Study section. Redrow PLC is an organization that is based in Britain and is involved in residential development. Redrow PLC own’s Harrow Estates, which is focused on property and land solutions (Redrow 2016; Cahill 2012). Bellway PLC is a holding company also based in Britain. It owns subsidiary undertakings and it mainly engages in building houses in Britain (Bellway 2016).
Research questions
Is Bellway in a better financial position than Redrow?
Which company is more profitable for investors between Bellway and Redrow?
Which of these two companies is better positioned to exploit the opportunities in its environment?
Literature Review
The selected companies: Redrow PLC and Bellway PLC
Redrow PLC is a firm that is based in the United Kingdom. It is engaged in residential development. Redrow PLC own’s Harrow Estates, which is focused on property and land solutions (Redrow 2016). Redrow PLC is involved primarily in construction and building of residential properties. It provides its services only within the United Kingdom. Redrow PLC has a land bank of over 12,000 development lots giving the firm about 4-year supply of buildable land, which provides a buffer against abrupt increases in land prices (Redrow 2016).
Bellway PLC is a holding company that is based in the United Kingdom. It owns subsidiary undertakings and it largely engages in contructing houses in the United Kingdom (Bellway 2016). Bellway PLC has quite a few subsidiaries the main one being Bellway Properties Limited. Bellway PLC operates in England, Scotland and Wales only. It does not have operations in Northern Ireland. The land bank owned and controlled by Bellway PLC is roughly 34,070 plots (Bellway 2016).
In the 2015 financial year, Bellway sold in excess of 7,760 houses at an average price of roughly £224,000; about eighty percent of which were sold privately and the remainder being sold as social housing. Bellway PLC gives emphasis to sales volume growth and it frequently buys land particularly at low-cost at locations where it can develop (Bloomberg 2016).
Industry: Home Construction / Real Estate
Bellway PLC and Redrow PLC both operate in the United Kingdom’s home construction industry. This is because both companies are engaged in the construction of buildings: that is, they build and develop houses and homes. They construct and develop houses and homes of different types and sizes for diverse markets (Cave 2015; Lai 2013). The housing market in the United Kingdom has been growing steadily (Willer 2016). This steady growth is largely attributed to the aging UK population which increases demand for property overall (Everett & Duval 2010; Stewart 2013).
The long-term trend for house prices in Britain is upwards, although changes in the prices of houses are very cyclical (Cave 2015; Brennan 2013). In the housing market of the United Kingdom, about 250,000 new homes are needed to be built annually in order to stay abreast of the demand (Bourke 2012; Elliot 2013). Even though the construction sector in general in Britain has slowed down, the homebuilding sub-sector has seen a rise in the construction of new homes (Canocchi 2016; Cunningham 2012; Roxburgh 2011).
SWOT analysis
SWOT – strength, weakness, opportunity and threat – analysis is utilized in evaluating a company’s position and guide strategy going forward. Strengths – these are the qualities which determine a company’s success. Strengths allow an organization to attain its mission. Strengths could be intangible or tangible and include qualities and traits that staff members have as well as their flair which offers the company consistency (Everett 2014). Examples of strengths include no debt, workers who are committed, and huge monetary resources.
Weaknesses – these refer to the qualities which impede the productivity of a company preventing the company from attaining its mission and achieving its full potential. Even so, weaknesses can be controlled and the impact and magnitude of the damage could be decreased. SWOT analysis helps not just to identify the weaknesses of a company, but also provides a chance of reversing those weaknesses (Everett 2014).
Opportunities – there are an extensive range of opportunities present in the environment where the company operates. An organization could always benefit from such opportunities, which could arise out of the market, technology or competition. It is notable that existing opportunities could be the utilization of novel technology, exploiting the company’s untapped resources, and failure of a competitor (Fine 2011).
Threats – these are the elements of vulnerability which could jeopardize the organization’s profitability and reliability. They are unavoidable and cannot be controlled. They have to be addressed so as to find a practicable solution (Pickton & Wright 2014).
Fine (2011) noted that a SWOT analysis is a vital part of the strategic planning process of an organization as offers a good all-round perspective of the forward-looking and current situation of the business. The Weaknesses and Strengths sections provide a look at the current position of the company whereas the Threats and Opportunities sections help in projecting challenges as well as possibilities going forward (Bensoussan 2013). SWOT analysis is a suitable tool for strategic planning.
As a result of the analysis, the business owner would be able to set organizational goals and objectives and obtain a clearer picture for basing his decisions on (Lu 2010). In addition, SWOT analysis helps the business owner to utilize a strategy to match the company’s opportunities and threats, and utilize those strategies to convert the threats and weaknesses of the company into its opportunities and threats (Bensoussan 2013). Although a SWOT analysis allows a business owner to identify and understand important issues that affect the company, SWOT analysis does not essentially provide solutions (Fine 2011).
Ratio Analysis Theory
This theory is relevant to the present research paper. Analysis of fiscal reports necessitates skill of statistical tools, accountancy, and mathematics. There are several fundamental ratios that could help anyone in analyzing an organization’s Profit & Loss Account and Balance Sheet for instance current ratio, provisioning coverage ratio, credit deposits ratio, debtors turnover ratio among others. A wide range of fiscal data could be obtained from Annual Reports, Profit and Loss Account, Audit Report, Balance Sheet, Bank Loan Statement, Bank Account Statement, and Income Tax Return.
Financial Statements
Common fiscal statements include cash flow statement, balance sheet, and income statement, and they are all interconnected. The cash flow statement explains cash outflows as well as cash inflows, and it reveals the amount of money which the business has available on hand, which is reported in the balance sheet also. The income statement is used in describing the way liabilities and assets were utilized in the stated accounting period (Routh 2014).
Every financial statement by themselves only offer a portion of the story of the fiscal condition of the business. When taken together however, the fiscal statements offer a more comprehensive picture (Putra 2015). Potential creditors and stockholders usually analyze the fiscal statements of a business organization and compute several fiscal ratios with the data they contain with the aim of identifying the fiscal weaknesses and strengths of the company and establish whether or not the firm is actually a good investment/credit risk (Kumara 2012). In addition, the fiscal statements of a company are usually utilized by the managers as it aids them in making decisions (Routh 2014).
One particular significant way in which the three fiscal statements are utilized together is in calculating free cash flow (FCF). Investors who are smart prefer business organizations which generate lots of FCFs. This is primarily because it signals the ability of the firm to pay off its debt as well as dividends, facilitate the company’s growth, and buy back stock – all vital undertakings from the perspective of an investor (Routh 2014). Even so, whilst free cash flow is an essential gauge of the health of the business, it actually has its limits; as Lan (2014) pointed out, free cash flow is really not immune to accounting trickery.
Financial Statement Analysis
Financial analysis or financial statement analysis is the process in which the fiscal statements of a company are reviewed in order to make better financial decisions. Financial analysis focuses on analyzing a company’s income statement and balance sheet to interpret the business as well as the company’s fiscal ratios for fiscal forecasting, business evaluation, and even fiscal representations (Grimm & Blazovich 2016).
The main fiscal statements include Statement of Cash Flows, Balance Sheet, and Income Statement (Routh 2014). Financial analysis is a process or technique that involves certain methods for assessing fiscal health, performance, risks, as well as the company’s future prospects.
Financial statement analysis is utilized by many stakeholders including equity and credit investors, decision-makers with the company, the public, and even the government. These different stakeholders have various interests and they apply dissimilar techniques in meeting their needs (Lan 2014). Creditors, for example, want to ensure the principal and interest is paid on the debt securities of the organization whenever due. Equity investors are interested in the organization’s long-term earnings power and the growth and sustainability of dividend payments. Some of the common financial analysis methods include DuPont analysis, fundamental analysis, vertical and horizontal analysis, as well as the use of financial ratios. To project performance of the future, historical information combined with several adjustments and suppositions to the fiscal information might be utilized.
Methods of financial analysis
Ratio analysis
Financial ratios are essential tools for performing analysis of financial statements quickly. There are 4 different classifications of financial ratios: leverage, activity, profitability, and liquidity ratios. These financial ratios are usually analyzed across competitors within the industry and over time (Routh 2014). In analyzing the financial statement of a company using the ratio analysis method, various types of ratios are used.
Want help to write your Essay or Assignments? Click here
Liquidity Ratios: these are utilized in determining how fast an organization is able to turn its assets into cash in the event that the business faces insolvency or fiscal challenges. In essence, liquidity ratios are a measure of the capacity of an organization to remain in business (Routh 2014). Some of the liquidity ratios include the liquidity index and the current ratio.
Current ratio is used to measure the current assets of an organization against the organization’s current liabilities (Altman 2012). The current ratio is used in measuring the amount of liquidity that is available to pay for liabilities (Lan 2014). It is notable that the current ratio indicates whether or not the corporation is capable of paying off its short-term liabilities during a situation of emergency through liquidating its current assets (Lan 2014).
A low current ratio means that the company might find it difficult to pay its current liabilities within the short run hence it should be investigated more. If the current ratio is less than one for example, it indicates that even when the firm liquidates its entire current assets, it will still not be able to pay off its current liabilities (Routh 2014).
Quick ratio helps to compare the accounts receivable, short-term marketable securities, and the cash to the company’s current liabilities. If quick ratio is 0.55 for example, it means that the firm is only able to cover 55 percent of current liabilities by monetizing accounts receivable, liquidating short-term marketable securities, and utilizing all cash-on-hand (Lan 2014).
Cash ratio is computed as cash and short-term marketable securities divided by organization’s current liabilities. It is worth mentioning that a cash ratio of 0.31 will mean that the firm could only pay off 31 percent of its current liabilities with the use of its short-term marketable securities as well as cash.
Liquidity index is also one of the liquidity ratios although is not very popular. It is used to measure the period of time that is needed for converting assets into cash (Batta, Ganguly & Rosett 2014).
Want help to write your Essay or Assignments? Click here
Activity Ratios: these ratios essentially demonstrate how well the company’s top executives are managing the resources of the organization. Accounts receivable turnover and accounts payable turnover are some of the common activity ratios. They show the period it takes for an organization to get payments and how long it takes for an organization to pay off its accounts payable (Routh 2014). Other activity ratios include sales to working capital ratio, fixed asset turnover ratio, working capital turnover ratio, and inventory turnover ratio.
Profitability Ratios: these are ratios which show how profitable an organization is. The gross profit ratio and the breakeven point are some of the common profitability ratios. The breakeven point is used in computing the amount of money which the organization has to generate in order for it to break even with its start up costs (Knežević, Rakočević & Đurić 2011). The gross profit ratio shows a quick snapshot of the anticipated revenues.
Leverage Ratios: these show how much an organization depends on its debt in funding its operations. The debt-to-equity ratio is a popular leverage ratio utilized in analyzing financial statements (Johnson 2013). The debt-to-equity ratio depicts the degree to which the company’s top executives are willing to utilize debt in funding the company’s operations. It is computed as follows: (Leases + Short-term debt + Long-term debt) / Equity (Lan 2014).
Vertical analysis
Besides ratio analysis, the other method that can be used to analyze financial statements is the use of vertical and horizontal analysis. Vertical analysis, as Lan (2014) pointed out, reiterates every figure in the income statement as a percentage of net sales. Vertical analysis is important as it allows the top managers to understand if expenses such as Cost of Goods Sold (COGS) are very high in comparison to sales (Andrijasevic & Pasic 2014).
In essence, vertical analysis is the proportional analysis of a fiscal statement in which every line item on the fiscal statement is listed as a percentage of another item (Routh 2014). This essentially implies that each line item on the balance sheet is stated as a percentage of total assets whilst on the income statement, each line item is stated as a percentage of gross sales (Teodor & Radu 2013). All in all, vertical analysis brings about common-size fiscal statements. Boyd et al. (2014) noted that common-size income statements present each of the amount in the income statement as a proportion of sales.
This is used to compare ratios and account balances over various periods of time. It can be used, for instance, in comparing a company’s sales in 2012 to the company’s 2013 sales (Boyd et al. 2014).The financial analysis for the two companies is illustrated exhaustively in the Study section. The analysis includes the horizontal/trend analysis, vertical analysis, and ratio analysis (Monea 2013). The horizontal analysis entails comparing fiscal information over a number of reporting periods. Horizontal analysis is therefore the review of the results of several periods of time (Luypaert, Van Caneghem & Van Uytbergen 2016).
Financial statement analysis is important due to several advantages it presents to an organization. Firstly, financial analysis offers an idea to investors about deciding on investing their money in a certain business organization (Damjibhai 2016). Secondly, various regulatory authorities such as IASB could ensure that the business organization is in fact following the necessary accounting standards (Routh 2014).
Therefore, the analysis enables the company to remain compliant (Ednlister 2012). Thirdly, the analysis of financial statements helps government agencies to analyze the taxation that is owed to the company (Beutler 2014). Fourthly, financial statement analysis enables the company to analyze its own performance over a certain period of time (Routh 2014).
References
Altman, EI 2012, ‘Financial ratios, discriminant analysis and the prediction of corporate bankruptcy’, Journal Of Finance, 23, 4, pp. 589-609, Business Source Complete, EBSCOhost, viewed 30 June 2016.
Andrijasevic, M, & Pasic, V 2014, ‘A blueprint of ratio analysis as information basis of corporation financial management’, Problems Of Management In The 21St Century, 9, 2, pp. 117-123, Business Source Complete, EBSCOhost, viewed 30 June 2016.
Barnard, L 2011, ‘bellway jv reaches into barking’, Estates Gazette, 733, p. 04, Business Source Complete, EBSCOhost, viewed 30 June 2016.
Batta, G, Ganguly, A, & Rosett, J 2014, ‘Financial statement recasting and credit risk assessment’, Accounting & Finance, 54, 1, pp. 47-82, Business Source Complete, EBSCOhost, viewed 30 June 2016.
Bensoussan, BE 2013, Analysis without paralysis: 12 tools to make better strategic decisions. Oxford, England: Oxford University Press.
Beutler, IF 2014, ‘What Makes Wealth Grow? A Wealth Sensitive Financial Statement Analysis’, Journal Of Financial Counseling & Planning, 25, 1, pp. 90-104, Business Source Complete, EBSCOhost, viewed 30 June 2016.
Bourke, C 2012, ‘Further losses for major housebuilders’, Estates Gazette, 836, p. 54, Business Source Complete, EBSCOhost, viewed 30 June 2016.
Boyd, K., Epstein, L., Holtzman, M., & Loughran, M 2014, Horizontal and vertical analysis. Coventry, England: John Wiley & Sons.
Brennan, H 2012, ‘NewBuy rates do not reflect scheme’s risk profile, says Redrow’, Money Marketing (Online Edition), p. 5, Business Source Complete, EBSCOhost, viewed 30 June 2016.
Cahill, J 2012, ‘Hammonds partner quits for Redrow in-house role’, Lawyer, 16, 44, p. 3, Business Source Complete, EBSCOhost, viewed 30 June 2016.
Cave, A 2015, Redrow Cuts Exposure to London Values, Daily Telegraph.
Cunningham, D 2012, ‘Bellway appoints Ayres as chief executive’, Estates Gazette, 1232, p. 03, Business Source Complete, EBSCOhost, viewed 30 June 2016.
Damjibhai, SD 2016, ‘Performance Measurement Through Ratio Analysis: The Case of Indian Hotel Company Ltd’, IUP Journal Of Management Research, 15, 1, pp. 30-36, Business Source Complete, EBSCOhost, viewed 30 June 2016.
Ednlister, RO 2012, ‘An empirical test of financial ratio analysis for small business failure prediction’, Journal Of Financial & Quantitative Analysis, 7, 2, pp. 1477-1493, Business Source Complete, EBSCOhost, viewed 30 June 2016.
Elliott, G 2013, ‘Redrow and place of supply’, Accountancy, 125, 1281, p. 138, Business Source Complete, EBSCOhost, viewed 30 June 2016.
Everett, R, & Duval, C 2010, ‘Some considerations for the use of strategic planning models’, Proceedings For The Northeast Region Decision Sciences Institute (NEDSI), pp. 525-530, Business Source Complete, EBSCOhost, viewed 30 June 2016.
Everett, RF 2014, ‘A Crack in the Foundation: Why SWOT Might Be Less Than Effective in Market Sensing Analysis’, Journal Of Marketing & Management, Special 1, pp. 58-78, Business Source Complete, EBSCOhost, viewed 13 July 2016.
Fine, LG 2011, The SWOT Analysis: Using your strength to overcome weaknesses, using opportunities to overcome threats. Coventry, England: SAGE Publications.
Furber, S 2014, ‘Bellway toasts 11.7% NAV rise’, Estates Gazette, 1442, p. 03, Business Source Complete, EBSCOhost, viewed 30 June 2016.
Grimm, S, & Blazovich, J 2016, ‘Developing student competencies: An integrated approach to a financial statement analysis project’, Journal Of Accounting Education, 35, pp. 69-101, Business Source Complete, EBSCOhost, viewed 30 June 2016.
Jagger, S 2015, Redrow Poised To Finalise Pounds 34.5m ICI Land Bank Deal. Daily Telegraph
Johnson, CG 2013, ‘Ratio analysis and the prediction of firm failure’, Journal Of Finance, 25, 5, pp. 1166-1168, Business Source Complete, EBSCOhost, viewed 30 June 2016.
Knežević, S, Rakočević, S, & Đurić, D 2011, ‘Implementation and Restraints of Ratio Analysis of Financial Reports in Financial Decision Making’, Management (1820-0222), 61, pp. 24-31, Business Source Complete, EBSCOhost, viewed 30 June 2016.
Kumara S 2012, ‘Ethic – based management vs corporate misgovernance — new approach to financial statement analysis’, Journal Of Financial Management & Analysis, 25, 2, pp. 29-38, Business Source Complete, EBSCOhost, viewed 30 June 2016.
Lai, S 2013, ‘Redrow Homes Ltd and Another v Bett plc and Another [1998] 1 All ER 385’, Journal Of Financial Crime, 6, 3, p. 252, Business Source Complete, EBSCOhost, viewed 30 June 2016.
Lan, J 2014, Financial ratios for analyzing a company’s strengths and weaknesses. AAII Journal, 3(7):1-13.
Lundholm, R., & Sloan, R 2011, Equity Valuation and Analysis, 2nd edn (McGraw-Hill Irwin, New York, NY).
Luypaert, M, Van Caneghem, T, & Van Uytbergen, S 2016, ‘Financial statement filing lags: An empirical analysis among small firms’, International Small Business Journal, 34, 4, pp. 506-531, Business Source Complete, EBSCOhost, viewed 30 June 2016.
Lu, W 2010, ‘Improved SWOT Approach for Conducting Strategic Planning in the Construction Industry’, Journal Of Construction Engineering & Management, 136, 12, pp. 1317-1328, Business Source Complete, EBSCOhost, viewed 30 June 2016.
McClary, S 2014, ‘Redrow doubles net debt’, Estates Gazette, 1436, p. 54, Business Source Complete, EBSCOhost, viewed 30 June 2016.
Monea, M 2013, ‘Information system of the financial analysis’, Annals Of The University Of Petrosani Economics, 13, 2, pp. 149-156, Business Source Complete, EBSCOhost, viewed 30 June 2016.
Pickton, D, & Wright, S 2014, ‘What’s swot in strategic analysis?’, Strategic Change, 7, 2, pp. 101-109, Business Source Complete, EBSCOhost, viewed 30 June 2016.
Putra, LD 2015, Horizontal vs vertical analysis of financial statements. Accounting and Financial Tax, 2(9): 11-19
Robinson, TR 2011, International Financial Statement Analysis, Hoboken, N.J.: Wiley, eBook Collection (EBSCOhost), EBSCOhost, viewed 30 June 2016.
Routh, B 2014, Financial statement analysis: Vertical analysis. Oxford, England: Oxford University Press.
Roxburgh, H 2011, ‘Builders seek £840m to fix finances’, Estates Gazette, 938, p. 46, Business Source Complete, EBSCOhost, viewed 30 June 2016.
Stewart, A 2013, ‘The storm before the calm’, Estates Gazette, 831, p. 37, Business Source Complete, EBSCOhost, viewed 30 June 2016.
Teodor, H, & Radu, M 2013, ‘Diagnosis of financial position by balance sheet analysis – case study’, Annals Of The University Of Oradea, Economic Science Series, 22, 2, pp. 530-539, Business Source Complete, EBSCOhost, viewed 30 June 2016.
A low calorie or healthy option microwavable food is a fresh concept which has gained a lot of interest among consumers. A majority of consumers are evaluating the food products provided in the market and consideration is given to the healthiest diet. Thus, introduction of microwavable products made up of low calorie has gain a high market due to consumer’s health concerns. To cater for the needs of the market, managers must formulate methods that will increase the product’s market share and profitability while increasing value to consumers.
As such, the intention of this paper is to outline a plan for managers in anticipation of rising prices, examine the major effects the government have on production and employment, determine whether government regulations are fair in the food industry, examine the major complexities under expansion via capital projects, and lastly suggest how a company could create convergence between the interests of stock holders and managers. The Company aims to keep the prices of its products as inelastic as possible.
Low calorie dietary is the new form of healthy foods and it has gained a lot of popularity among the consumers. In schools, homes, and restaurants, the concept of healthy feeding is not new. With the emergence of many chronic diseases, people desire to live healthy lives and lifestyles, thus the need for low calorie diets as will be produced and sold by Lean.
The purpose of this paper is to assess the main impacts the government has on production and employment, if government policies and laws facilitate fairness, determine the complications of expansion, and finally, offer recommendation on the merger of a company’s stakeholders and the management. For sustainable growth and profitability, the firm seeks to have the prices of its products as inelastic as it possibly can (Sullivan and Sheffiran 2013).
It therefore means that the strategy used for pricing should have no effect on the way consumers recognize and purchase the commodities. In general, the type of demand occurs only for products that are essential for the normal living of consumers. However, the situation is not the same for food products that are microwavable. Elasticity of demand for low calorie products highly depends on the offered price, availability of substitutes, expenditure on promotions, income level of consumers, and prevailing economic conditions.
Considering the demand function and elasticity, low calorie products are favorable in a monopolistically dominated market. In a monopolistic competitive market, buyers and sellers are usually few. Therefore, if one company raises its prices, consumers shifts to another brand. As thus, firms in this market increase demand for their products through differentiation.
ThProfit (NP) = Total revenue (TR) Total Cost (TC)
According to the FOC of profit maximization,
=Marginal Revenue =Marginal Cost = 0
So Marginal Revenue = Marginal Cost
By applying the elasticity of 1.9, it was stipulated that demand for low calorie microwavable processed products is low. Since the company purposes to keep the prices of the products inelastic, it will strategize on differentiation to obtain a competitive advantage in the market. Differentiation is important since consumers will be able to pick the product from other substitutes hence increasing the sales. More so, it is proved that when product differentiation is noticeable to competitors, a firm’s market power and leadership increases. As such, it is advisable for the firm to strategize on product differentiation to increase the rate of returns.
Globally, the government usually has the mandate of regulating the market to protect consumers and the firms. However, whether markets are regulated or unregulated they are always influenced by the forces of demand and supply. As such, government regulation is critical for stability. For instance, the government handles externalities through provision of public utilities such as roads, contracts enforcements, and supply of currency (Wall and Griffin 2013). All theses aspects are better done by the government compared to private firms whose main aim is profit making.
A lot of discussion has been made on determination of the activities that the government is limited. Though regulations are important, extreme policies and laws are adverse to the growth of an economy. An ideal economic climate is only possible when government regulations are in accordance with the prevailing market conditions. The main reasons that the government involves itself in a market are enactment of policies and rules to facilitate exchange between buyers and sellers, and enforcement of the policies.
In the area of employment government sets rules for employers to follow when selecting, recruiting, and compensation. No employee should be paid below the set minimum wage rate, they are to be treated humanely and allowed to interact and work freely without fear of intimidation. Labor unions and other industrial agencies set regulations for firms follow failure to which employees have the right of suing the firm.
The government also limits production through the taxation rates, production costs, and prices for raw materials (Frank 2013). When terms are favorable, firms are able to produce to full capacity but when there is over production, the government sets higher terms to stabilize the market. As such, the effects the government will have on the company are limitation of production capacity and selling prices, employment, and eventually profitability since regulations are costly to the firm.
It is the mandate of the government to ensure the market is stable and at equilibrium for benefit of all stakeholders (MIT 2012). For instance, without intervention, big mergers and monopolistic conditions would be possible leading to excessive exploitation of the consumers. Thus, the government gets involved by limiting mergers and monopoly situations. It is fair for the government to get involved in the low calorie microwavable commodities to control prices, limit entrants and exit for fair market competition, and avoid emergence of monopolistic powers that would made the firm irrelevant.
When many unregulated firms are in the market, price wars would lead to consistent low prices causing the prices to be unstable. More so, unregulated market causes poor quality goods to be introduced as firms seek to minimize production costs for profits.
Thus, the major reasons for government involved are to control prices, ensure that the market is stable for protection of local firms, and protect consumers from exploitation. For microwavable foods, firms have to correctly label the contents of the products and they should be processed in certain measures to avoid provision of unhealthy contents. Moreover, regulations also assist in protection of the environment where firms are supposed to observe efficient waste management practices, as well as reduce usage of production methods that release poisonous gasses in the environment.
An example of government involvement is the control of industries in China which have the tendency of producing smog that forcing people to wear masks to avoid getting contaminated. These goods are exported to US and other countries and the government has set measures to control the packaging of the products, their distribution and usage. Additionally, the government enforces policies to regulate the banking and finance industry by setting minimum interest rates so that consumers are not exploited and for banks to remain in business.
Some capital projects that the firm could undertake are mergers or acquisitions for expansion purposes. The reason for the projects is to increase market share, share operational risks, and increase market leadership and profitability (Harris et al. 2014). However, these projects bring complexities such as collusion between the shareholders and management. Managers tend to get additional capital from the reserves or by requesting shareholders to top up using their savings.
Shareholders may not be willing to use their reserves or contribute extra capital due to uncertainty of the venture. To avoid the complexity, managers should undertake projects that have high chances of generating returns in the short run by carrying out comprehensive evaluation of the project. For instance, managers should acquire a brand that is already dominating in the market to avoid experiencing losses.
Convergence between managers and shareholders is created through a firm’s strategic decision making process and through the use of financial statements. Whereas the shareholders own the company, they have limited control over the decision making process and the actions of management. On the other hand, managers are responsible for controlling the affairs of the firm.
Managers seek for higher income and allowances irrespective of a firm’s performance while shareholders are usually interested in higher profits for increased dividends. As such, shareholders seek for firm’s growth through mergers. However, mergers may compromise manager’s job security and control leading to divergence between the interests of shareholders and managers.
Therefore, strategic decision making should be done such that managers get allowances and salaries depending on the generate profits. If profits are high, their salaries are high and vice versa. As a result, managers will become productive so as to get high profits and allowances and in the process, the interests of shareholders will be met and both parties will be satisfied. Therefore, convergence of shareholders and managers lead to higher profits since managers become preoccupied in generating high revenues so that they pay is high and when the revenues are high, dividends are also high.
Instances that bring convergence of the interests of managers and shareholders include: managers being employed on contractual terms such that their contracts are renewable if they perform as required, and application of commission terms whereby managers are paid depending on the income generated at a certain period.
It therefore shows that the government should get involved in microwavable food market to ensure products are of high quality, control monopoly activities, and stabilize the market. For better returns, managers and shareholders should have a common vision and the needs of each party considered. The firm is likely to excel and attain market leadership through product differentiation since demand is inelastic, ensure all the needs of stakeholders are met, and follow government conditions as they relate to production and employment.
References
Frank, R. (2013). Microeconomics and Behavior, (7th ed.). New York, NY: McGraw-Hill.
McGuigan, B. P., Moyer, R. C., &Harris, F. H. (2014).Managerial economics: Applications, strategies and tactics, (13th ed.). Stamford, CT: CengageLearning.
Mit. (2012). Government Regulations in the Market. University of Cambridge.