Want help to write your Essay or Assignments? Click here
Tensile Testing
Summary
Tensile testing is undeniably the most imperative experimental method that is used in determining the characteristics or properties of various materials for the purpose of predicting their behaviours as well as how they would respond to tension in their real world engineering applications. The specific properties of material that are determined through tensile test include maximum elongation, ultimate tensile strength as well as reduction in area.
The material properties are imperative in the selection of materials for mechanical design. In this lab experiment, a tensile tester was used to determine tensile properties of specimens of three materials namely duralumin, PVC and aluminium.
From the obtained tensile test results, duralumin properties including tensile strength (N/m2), yield stress (N/m2) and % elongation were 0.054 N/m2, 1.29231 N/m2 and 29.23 % respectively. In addition, those of PVC were 0.928 N/m2, 37.73585 N/m2 and 37.74 % for tensile strength (N/m2), yield stress (N/m2) and % elongation respectively; whereas those of aluminium were 0.083 N/m2, 0.65789 N/m2 and 65.79 % for tensile strength (N/m2), yield stress (N/m2) and % elongation respectively.
These properties show that both duralumin and aluminium are ductile and tough compared to PVC which indicate stiffness properties. These properties are further illustrated in the stress-strain plots of each material. In conclusion, the tensile test results obtained from this lab experiment are useful in determining tensile properties of materials as well as providing valuable information concerning not only the material’s mechanical behaviours but also its engineering performance.
Want help to write your Essay or Assignments? Click here
Introduction
The determination of the mechanical properties or characteristics of materials is done by performing laboratory experiments that are carefully designed so that they can be replicated under the same service conditions as nearly as possible. In real world applications of materials in mechanical engineering, there is involvement of myriad of factors in the determination of the nature in which application of loads can be done on a material (Czichos, 2006).
According to Ashby (2006) tensile testing is a fundamental test in material science where controlled tension is subjected to a sample until failure, and the obtained results often used for quality control and selection of materials for application. According to Hibbeler (2004), the specific properties of material that are determined through tensile test include maximum elongation, ultimate tensile strength as well as reduction in area. The material properties are imperative in the selection of materials for mechanical design (Davis, 2004).
Tensile testing is without any doubt the experimental method that is used in determining the characteristics of various mechanical materials with an intention of predicting the behaviours of such materials and how they would respond to tension in their real world engineering applications (Czichos, 2006).
The main objective of this experiment is to conduct an experimental tensile testing on various mechanical materials, i.e. duralumin, aluminium and PVC in order to determine and compare their characteristics, which can be used to predict their particular behaviours in real world engineering applications. The other main objective is to plot graphs describing the characteristics or properties of these materials as obtained in the tensile testing results.
As a result, graphs depicting the properties of these materials shall be plotted by stretching the samples of each of provided materials of known dimensions to destruction upon applying force subsequent to noting the ensuing elongation.
Thus, tensile test results obtained in this lab has many benefits because they enable a stress-strain diagram to be obtained, which is useful in determining the tensile properties of materials as well as providing valuable information concerning not only the material’s mechanical behaviours but also its engineering performance (Hibbeler, 2004).
Want help to write your Essay or Assignments? Click here
Theory
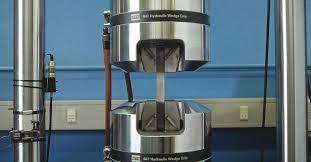
The topic covered in this lab experiment is focused to testing of tensile properties of various materials that have different compositions. Figure 1 illustrated below shows a machine used in tensile testing that resembles the one used during the laboratory experiment session. Tensile test is a destructive in nature, in which an axial is subjected to a sample of the material to be tested, and the specimen has to be of a standard shape as well as dimensions.
During a typical procedure for a tensile testing laboratory experiment, a specimen that dog-bone shaped is usually gripped at the top and bottom of the tensile machine on its two ends prior to pulling so that elongation occurs at a determined rate that is controlled up to its breakpoint (Hibbeler, 2004). Tensile testers vary mainly on the basis of pulling rate and maximum load, and their setup during an experiment could be varied for the purpose of mechanical testing of different materials through tensile test (Czichos, 2006).
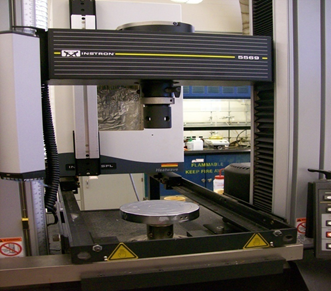
Figure 1: Tensile test 1 (A photograph of a tensile machine)
For analytical purposes, stress (σ) vs. strain (ε) is plotted from a tensile test experiment results, and this can be done either manually or automatically (Czichos, 2006). In the metric system, the usual measure for stress is Pa or N/m2, such that 1 Pa = 1 N/m2. From the laboratory experiment, the calculation of stress values is done through division applied force (F) by the cross-sectional area (A) of the machine, which is measured before the experiment is run (Hibbeler, 2004). Equation 1 and 2 below are used to calculate stress and strain values respectively.
Want help to write your Essay or Assignments? Click here
A typical stress-strain plot would look like figure 2 below, which is an example of a generalised and typical representation of a stress-strain curve for ductile metal materials (Davis, 2004). Figure 2 below indicates that the curve has four parts: elastic region, yielding region, strain hardening region and necking region, which occur in almost all materials except the strain hardening region commonly occurring in metallic materials (Czichos, 2006).

In theory, even without the specimen’s cross-sectional area measurement during the tensile testing lab experiment, it is possible to construct a “true” stress-strain curve based on the assumption that there is constant amount of the material. Using this concept, it is possible to calculate both the true strain (εT) and the true stress (σT) using Equation 3 and Equation 4, respectively.
Want help to write your Essay or Assignments? Click here
In the curve shown in Figure 2 above, the linear region, which is known as the elastic region depicts the region of the curve where the behaviour of the material is elastic. Equation 5 can be used to calculate the slope of the curve, which is an intrinsic property and is a constant of a material referred to as the elastic modulus (E). Its SI unit is Pascal (Pa).
Figure 3 shown below illustrates a typical stress-strain curve plot, and it shows that different materials, both metals and polymers portray varied properties under tension, which determines their greatest extent of deformation or ductility before fracture whereby some have very steep or relatively gentle elastic moduli.
According to Hibbeler (2004), mechanical properties of both metals and polymers are generally dependent on their molecular weights, extent of crystallinity, as well as glass transition temperature, Tg. For instance, if materials under consideration are highly crystalline and with a Tg higher than room temperature usually tend to be brittle, and vice versa (Davis, 2004).
On the other hand, when semi-crystalline polymers or materials are subjected to tensile testing, there will be an alignment of the amorphous chains usually evident for translucent and transparent materials, which have a tendency of becoming opaque after they turn crystalline.
The stress-strain curve is used to give Young’s Modulus based on the run and rise of the slope, which is calculated similar to the gradient of a curve within the yield strength range prior to the material entering the ultimate strength phase subsequent to fracturing (Ashby, 2006)

Figure 3: A typical stress-strain curve plot
Equipment and Procedure
Prior to beginning the experiment, the supplied guidance notes were carefully read after which the experiment setup of the tensile testing machine was confirmed to be alright. A photograph of the experiment is shown in Figure 4 below. Consequently, Figure 5 that follows is a detailed schematic diagram of a tensile testing machine showing the main parts.
Holding grips are used both at the top and bottom to hold the specimen in place firmly; load cell is used to provide the required weight depending on the sample material’s load range and sensitivity. In addition, the stationary base is used to ensure stability of the machine, while moving crosshead is used to adjust the load cell subjected to the material.
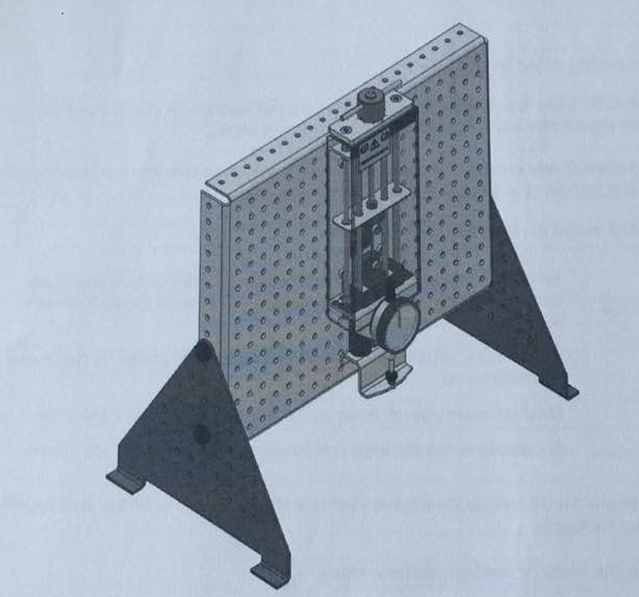
Figure 4: Experiment Setup Photograph of a Tensile Testing Machine
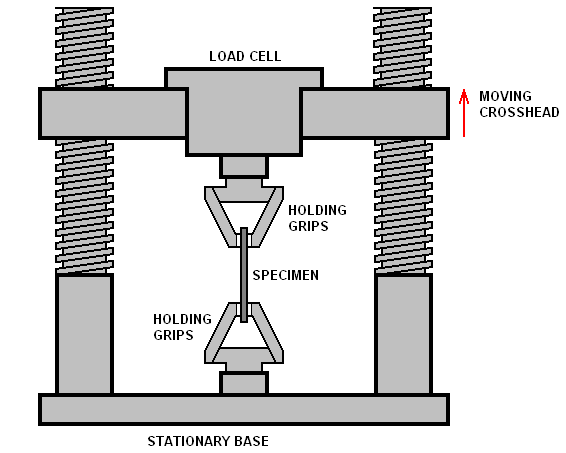
Figure 5: Detailed Schematic of a Tensile Testing Machine
Prior to starting the tensile test the safety guard was fitted followed by the selection of the specimen, which was then followed by the use of Dial Calliper for the width and thickness measurement of the specimen at gauge length as well as the cross-sectional area was determined.
The initial length of the specimen was measured and recorded or reference. The specimen was then fitted to the Tensile Tester followed by setting to zero the Dial Indicator, and the readings obtained for each specimen on the Vertical Scale were noted. Then the Load Nut was turned clockwise gradually in steps of 0.2 mm up to the length of 5 mm in a serial manner, and then followed by larger steps of 1 mm and 10 mm until the specimen broke.
The applied rate was kept consistent, i.e. 5 seconds were taken between each 0.2 mm of Load Nut turning followed by another 5 seconds for the readings to be recorded. The Dial Indicator value was recorded at each step, and for PVC specimen, this was done immediately after the load was change in order to obtain consistent results.
Want help to write your Essay or Assignments? Click here
The specimen elongation was checked by removing the specimen from the tensile tester and the broken ends were pushed together in order to measure the final length. The next step was conversion of the readings of the Dial Indicator into force values. The extension of the specimens at each step was determined by subtracting the readings of the Dial Indicator from those of the Load Nut movement.
The obtained values of force and extension were consequently converted to stress as well as nominal strain values, which were subsequently plotted on the chart paper for each specimen, i.e. the steel, PVC and alloy. The yield points and tensile strengths for each specimen were noted from the charts. Finally, the elastic region gradients for each specimen were determined for subsequent comparison of the stiffness of the materials.
Results and Discussion
The tensile testing results are shown in table 1 below where the results of the three specimens are illustrated on properties such as force, extension, strain and stress. In addition, tensile strength, yield stress and percentage of elongation are calculated and included in the table for duralumin, PVC and aluminium respectively. Furthermore, the stress-strain curves for each of the specimens are plotted to illustrate the relationships between the two properties in Figures 6, 7 and 8.
Table 1: Data collected from experiment 1
| Duralumin | PVC | Aluminium | |||||||||||||||
| Load Nut movement (mm) | Dial Indicator (mm) | Force (N) | Extension (mm) | Stress σ N/m2 | Nominal Strain ԑ | Load Nut movement (mm) | Dial Indicator (mm) | Force (N) | Extension (mm) | Stress σ N/m2 | Nominal Strain ԑ | Load Nut movement (mm) | Dial Indicator (mm) | Force (N) | Extension (mm) | Stress σ N/m2 | Nominal Strain ԑ |
| 0 | 0 | 0 | 0 | 0 | 0 | 0 | 0 | 0 | 0 | 0 | 0 | 0 | 0 | 0 | 0 | 0 | 0 |
| 0.2 | 1.65 | 0.2 | -1.45 | 0.12121 | -0.8787 | 0.2 | 0.36 | 0.2 | -0.16 | 0.55556 | -0.44444 | 0.2 | 0.62 | 0.2 | -0.42 | 0.32258 | -0.67742 |
| 0.4 | 1.865 | 0.4 | -1.465 | 0.21448 | -0.7855 | 0.4 | 0.495 | 0.4 | -0.095 | 0.80808 | -0.19192 | 0.4 | 0.98 | 0.4 | -0.58 | 0.40816 | -0.59184 |
| 0.6 | 1.91 | 0.6 | -1.31 | 0.31414 | -0.6858 | 0.6 | 0.52 | 0.6 | 0.08 | 1.15385 | 0.15385 | 0.6 | 1.29 | 0.6 | -0.69 | 0.46512 | -0.53488 |
| 0.8 | 1.96 | 0.8 | -1.16 | 0.40816 | -0.5918 | 0.8 | 0.63 | 0.8 | 0.17 | 1.26984 | 0.26984 | 0.8 | 1.41 | 0.8 | -0.61 | 0.56738 | -0.43262 |
| 1 | 2.09 | 1 | -1.09 | 0.47847 | -0.5215 | 1 | 0.61 | 1 | 0.61 | 1.63934 | 1 | 1 | 1.52 | 1 | -0.52 | 0.65789 | -1 |
| 1.2 | 2.14 | 1.2 | -0.94 | 0.56075 | -0.4392 | 1.2 | 0.59 | 1.2 | 0.61 | 2.0339 | 1.0339 | 1.2 | |||||
| 1.4 | 2.28 | 1.4 | -0.88 | 0.61404 | -0.3859 | 1.4 | 0.58 | 1.4 | 0.82 | 2.41379 | 1.41379 | 1.4 | |||||
| 1.6 | 2.44 | 1.6 | -0.84 | 0.65574 | -0.3442 | 1.6 | 0.56 | 1.6 | 1.04 | 2.85714 | 1.85714 | 1.6 | |||||
| 1.8 | 2.55 | 1.8 | -0.75 | 0.70588 | -0.2941 | 1.8 | 0.56 | 1.8 | 1.24 | 3.21429 | 2.21429 | 1.8 | |||||
| 2 | 2.68 | 2 | -0.68 | 0.74627 | -0.2537 | 2 | 0.55 | 2 | 1.45 | 3.63636 | 2.63636 | 2 | |||||
| 2.2 | 2.81 | 2.2 | -0.61 | 0.78292 | -0.2170 | 2.2 | 0.53 | 2.2 | 1.67 | 4.1509 | 3.15094 | 2.2 | |||||
| 2.4 | 2.89 | 2.4 | -0.49 | 0.8304 | -0.1695 | 2.4 | 0.53 | 2.4 | 1.87 | 4.5283 | 3.5283 | 2.4 | |||||
| 2.6 | 2.92 | 2.6 | -0.32 | 0.8904 | -0.109 | 2.6 | 0.52 | 2.6 | 2.08 | 5 | 4 | 2.6 | |||||
| 2.8 | 2.98 | 2.8 | -0.18 | 0.9396 | -0.060 | 2.8 | 0.51 | 2.8 | 2.29 | 5.4902 | 4.4902 | 2.8 | |||||
| 3 | 3.1 | 3 | 0.1 | 0.9677 | 0.0322 | 3 | 0.5 | 3 | 2.5 | 6 | 5 | 3 | |||||
| 3.2 | 3.11 | 3.2 | 0.09 | 1.0289 | 0.0289 | 3.2 | 0.5 | 3.2 | 2.7 | 6.4 | 5.4 | 3.2 | |||||
| 3.4 | 3.16 | 3.4 | 0.24 | 1.0759 | 0.0759 | 3.4 | 0.49 | 3.4 | 2.91 | 6.9387 | 5.93878 | 3.4 | |||||
| 3.6 | 3.19 | 3.6 | 0.41 | 1.1285 | 0.1285 | 3.6 | 0.49 | 3.6 | 3.11 | 7.3469 | 6.34694 | 3.6 | |||||
| 3.8 | 3.22 | 3.8 | 0.58 | 1.1801 | 0.1801 | 3.8 | 0.48 | 3.8 | 3.32 | 7.9166 | 6.91667 | 3.8 | |||||
| 4 | 3.23 | 4 | 0.77 | 1.2383 | 0.2383 | 4 | 0.47 | 4 | 3.53 | 8.5106 | 7.51064 | 4 | |||||
| 4.2 | 3.25 | 4.2 | 0.95 | 1.2923 | 0.2923 | 4.2 | 0.46 | 4.2 | 3.74 | 9.1304 | 8.13043 | 4.2 | |||||
| 4.4 | 4.4 | 0.46 | 4.4 | 3.94 | 9.5652 | 8.56522 | 4.4 | ||||||||||
| 4.6 | 4.6 | 0.45 | 4.6 | 4.555 | 10.222 | 10.12222 | 4.6 | ||||||||||
| 4.8 | 4.8 | 0.41 | 4.8 | 4.39 | 11.707 | 10.70732 | 4.8 | ||||||||||
| 5 | 5 | 0.36 | 5 | 4.64 | 13.888 | 12.88889 | 5 | ||||||||||
| 6 | 6 | 0.33 | 6 | 5.67 | 18.181 | 17.18182 | 6 | ||||||||||
| 7 | 7 | 0.29 | 7 | 6.71 | 24.13 | 23.13793 | 7 | ||||||||||
| 8 | 8 | 0.29 | 8 | 7.71 | 27.586 | 26.58621 | 8 | ||||||||||
| 9 | 9 | 0.28 | 9 | 8.72 | 32.142 | 31.14286 | 9 | ||||||||||
| 10 | 10 | 0.265 | 10 | 9.735 | 37.73 | 36.73585 | 10 | ||||||||||
| Tensile Strength (N/m2): 0.054 N/m2 | Tensile Strength (N/m2):0.928 N/m2 | Tensile Strength (N/m2): 0.083 N/m2 | |||||||||||||||
| Yield Stress (N/m2): 1.29231 N/m2 | Yield Stress (N/m2): 37.73585 N/m2 | Yield Stress (N/m2): 0.65789 N/m2 | |||||||||||||||
| % Elongation: 29.23% | % Elongation: 37.74% | % Elongation: 65.79% |
The figures below show the stress-strain plots for each of the specimens tested;
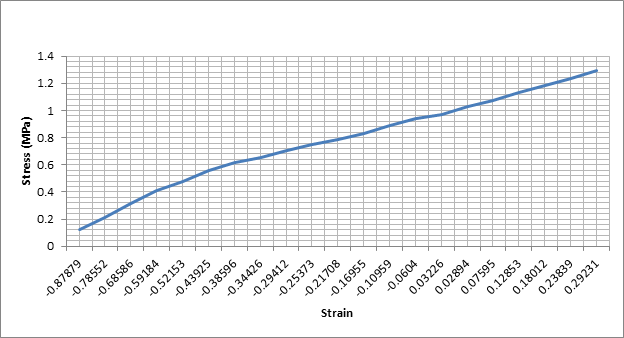
Figure 6: Duralumin Stress-strain plot
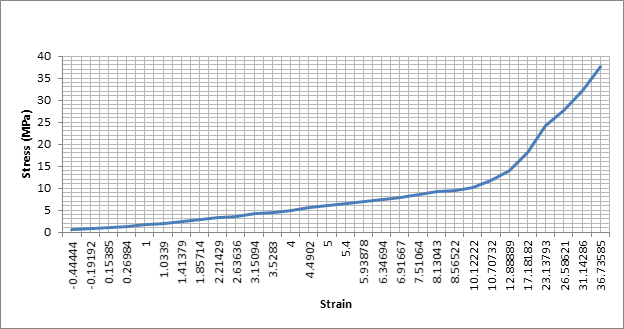
Figure 7: PVC Stress-strain plot
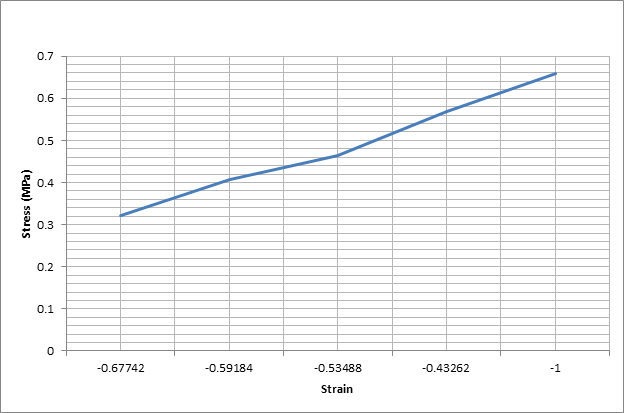
Figure 8: Aluminium stress-strain plot
From the tensile test results shown in table 1 above, duralumin properties including tensile strength (N/m2), yield stress (N/m2) and % elongation were 0.054 N/m2, 1.29231 N/m2 and 29.23 % respectively. In addition, those of PVC were 0.928 N/m2, 37.73585 N/m2 and 37.74 % for tensile strength (N/m2), yield stress (N/m2) and % elongation respectively; whereas those of aluminium were 0.083 N/m2, 0.65789 N/m2 and 65.79 % for tensile strength (N/m2), yield stress (N/m2) and % elongation respectively.
These characteristics show that both duralumin and aluminium are ductile and tough compared to PVC which indicate stiffness properties. These properties are further illustrated in the graphs.
Two specimen of the materials, i.e. duralumin and aluminium produced gradients that are relatively the same in their elastic region mainly because they are both metals even though one is a pure metal while the other one is an alloy. The reason why there is a significant difference between tensile properties of the two materials and PVC (which is a polythene polymer) is that, the chemical compositions are totally different hence making them to behave differently under tension (Davis, 2004).
Constant temperature and force application rate are very important for PVC specimens because it is composed of polymers, which easily change even with slight variations of temperature or force and this makes it imperative to ensure that both temperature and force application rate are maintained constant in order to obtain consistent results (Czichos, 2006).
Want help to write your Essay or Assignments? Click here
Some of the important shortcomings of the experimental apparatus is that, when large forces are been exerted there is a likelihood of the equipment to flex resulting to some extent of displacement (Tarr, n.d.). This machine’s displacement is often mistakenly read and recorded as a displacement of the specimen, and can lead to false results. To address this challenge, the tensile machine should be firmly held on the bench to ensure that no flexing occurs when large forces are applied on the specimens (Ashby, 2006).
Conclusion and Recommendations
By undertaking this lab experiment, I have learned a lot about the concept of tensile testing and my understanding on the same has significantly improved. For instance, I have gained more insights on how tensile properties differ between materials based on their chemical composition. In particular, the tensile properties of the three materials including tensile strength (N/m2), yield stress (N/m2) and % elongation varied considerably, especially between PVC and the other two materials (duralumin and aluminium) mainly due to their composition differences.
The specific aspects of the procedure of this lab experiment that contributed immensely to my learning was about the extension or elongation variations observed between materials before they broke, whereby significant difference was observed between metal specimens and PVC specimens. Prior to doing the lab experiment I had difficulties in comprehending how the tensile testing concept is used in choosing materials for mechanical engineering applications.
However, after the lab experiment my difficulties were alleviated by understanding how tensile strength, ductility, stiffness and brittleness of materials can be determined through this concept enabling selection of appropriate materials. The lessons learned in this lab experiment can be applied in future by extending acquired experience and skills to other mechanical testing such as compression, tear and shear.
References
Ashby, M. (2006) Engineering Materials 1: An Introduction to Properties, Applications and Design. 3rd ed. New York, NY: Butterworth-Heinemann.
Czichos, H. (2006) Springer Handbook of Materials Measurement Methods. Berlin: Springer.
Davis, J. R. (2004) Tensile testing. 2nd ed. New York, NY: ASM International.
Hibbeler, R. C. (2004) Statics and Mechanics of Materials. New York, NY: Prentice Hall.
Tarr, M. (n.d.) Stress and its effect on Materials [Online] available from http://www.ami.ac.uk/courses/topics/0124_seom/index.html. [Accessed 9 March 2016].
Want help to write your Essay or Assignments? Click here